USF AudioTutorial

Chapter 6 · Experimental Validation

From Theory to Hardware

The theory predicts three gains at a fixed bit budget: finer effective resolution (Remark 1), larger dynamic range (Remark 2) and lower error by \(20\log_{10}\DRX\) dB (Remark 3). This chapter checks them against the paper's own measurements: a custom modulo ADC behind a MEMS microphone, at 6 bits, on single tones, 14 real recordings, severe clipping, and 52 listeners. Every chart below is drawn from the paper's tables.

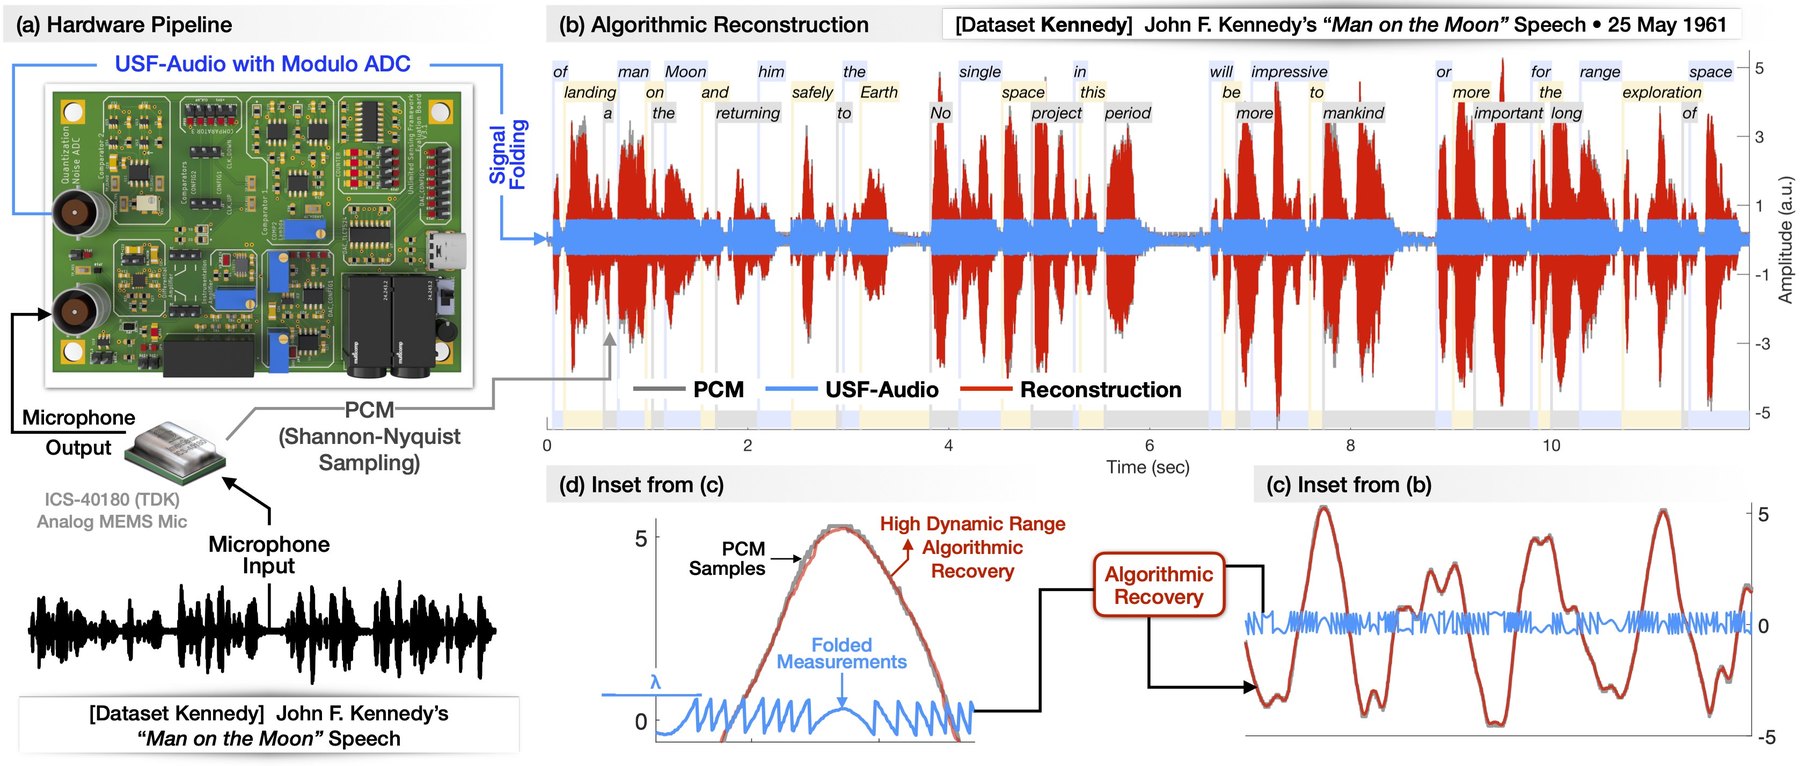
Fig. 2 of the paper: the USF-Audio hardware and the Kennedy recording: PCM, folded samples and reconstruction
Fig. 2 of the paper. Hardware and the Kennedy recording at 6 bits: \(\DRX=9.50\), resolution 0.0175 V against PCM's 0.1188 V, and a noise floor about 12 dB lower.

The Acquisition Pipeline

A MEMS microphone (Syntiant SPH8878LR5H-1) records a Bang & Olufsen Beoplay P2 loudspeaker. The analog signal feeds both the modulo ADC and a conventional reference ADC with the same nominal bit budget. Unless stated otherwise, sampling is at 250 kHz with 6 bits per sample, on a PicoScope 3406D.

The reference ADC spans \(\pm6.5\) V; the modulo measurements lie in \([0,1]\) V. All hardware data are captured through the front end, never folded or clipped digitally, so the gains include real analog non-idealities.

Recovery uses USF-ARA (Chapter 5) with \(N_g=500\) and \(\lambda=1/2\).

Evidence 1 · Table II

Resolution at the Converter

Metric
Experiment

Dynamic Range

conventional ADCUSF-Audio

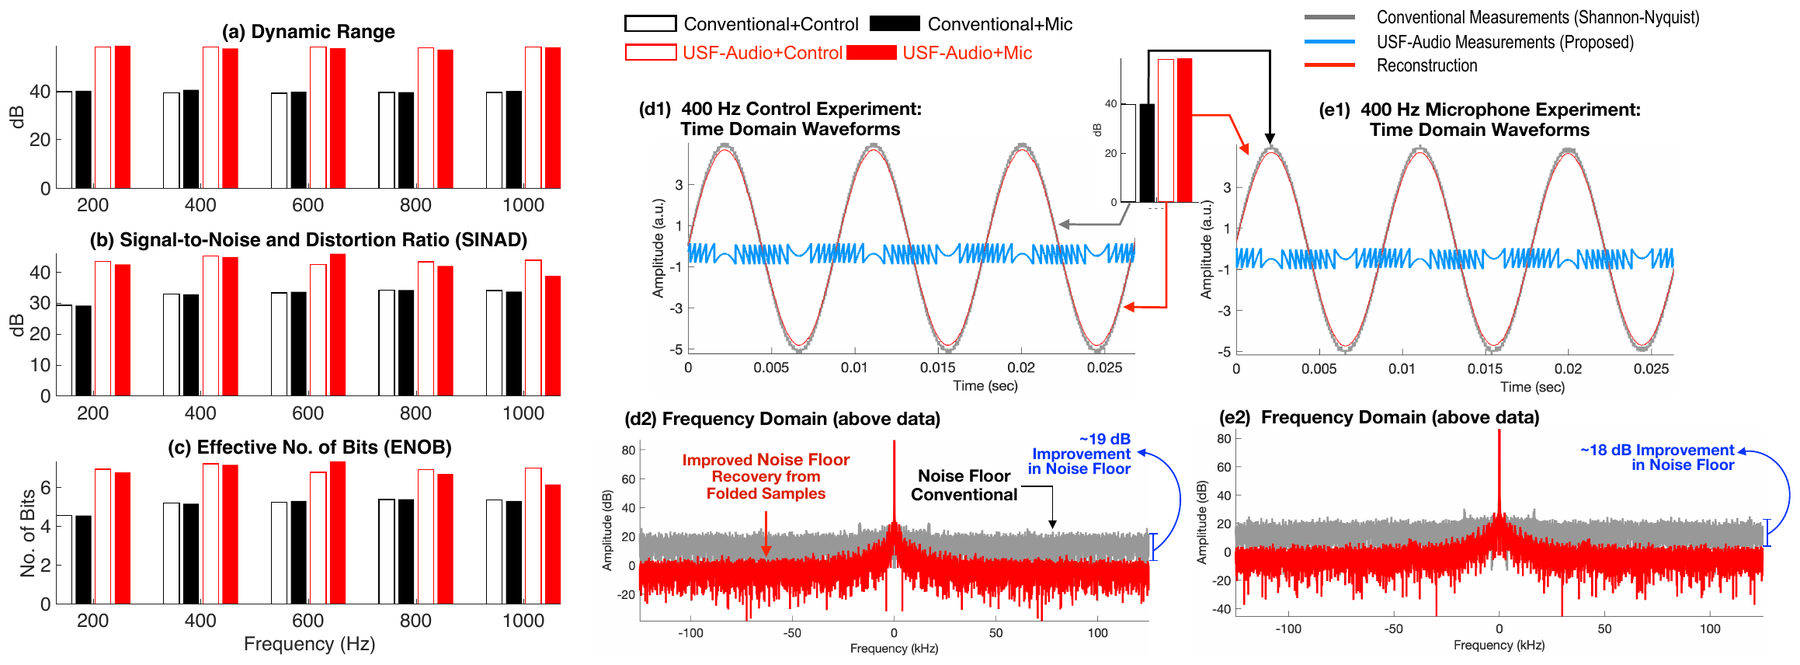
Fig. 4 of the paper: dynamic range, SINAD and ENOB bars, with 400 Hz time and frequency-domain traces
Fig. 4 of the paper. Single tones from 200 to 1000 Hz, directly from a waveform generator (controlled) or through speaker and microphone. \(N=8918\), \(N_g=500\), \(\lambda=0.47\). Resolution: 0.20 (ADC) against 0.02 (USF-Audio).
Evidence 2 · Table VI

Fourteen Hardware Recordings

Gain plotted

Measured Gain Versus Theory

datasetRemark 3: \(20\log_{10}\DRX\)

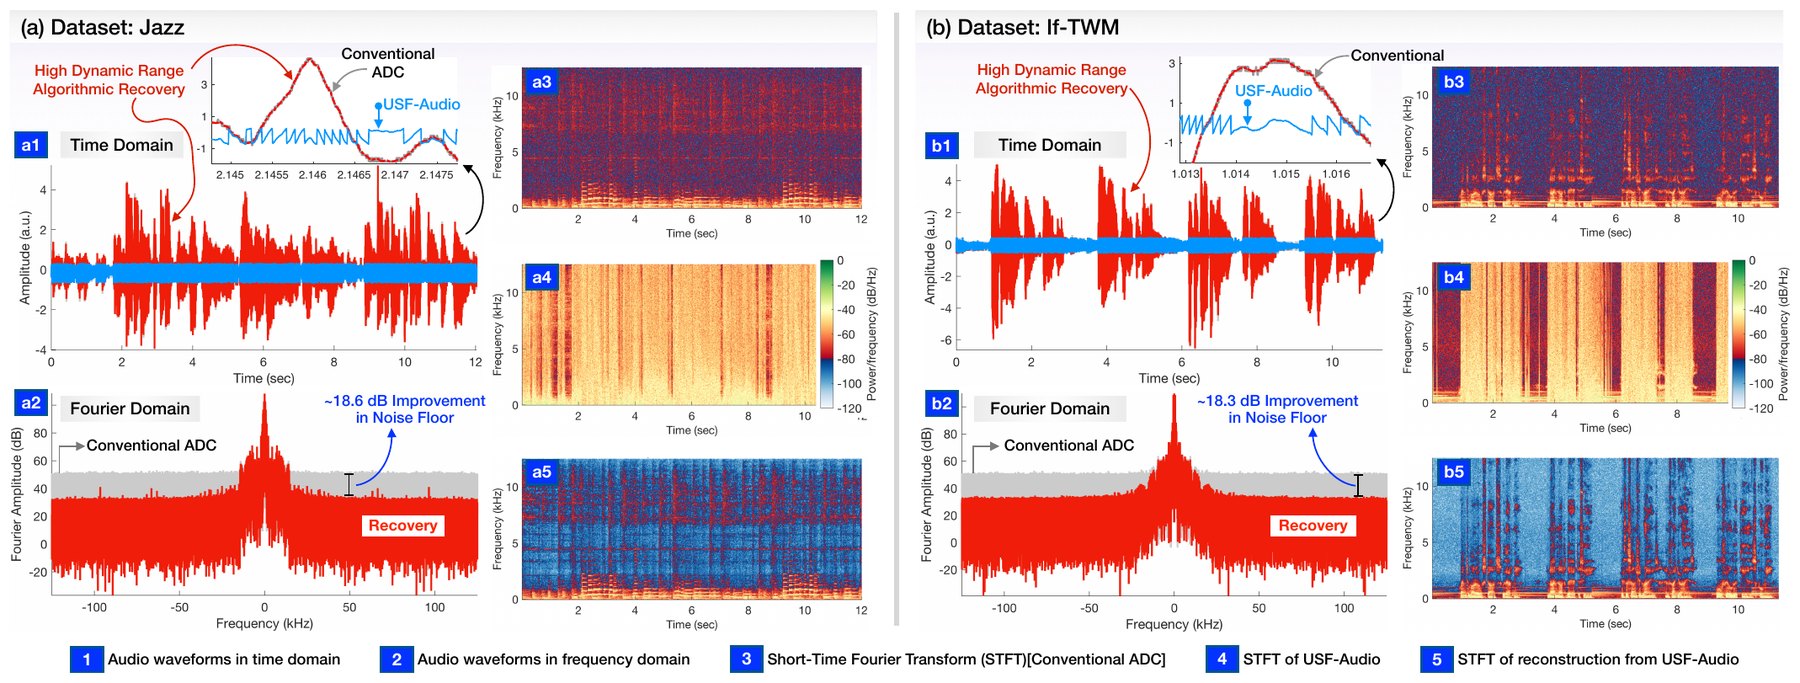
Fig. 8 of the paper: Jazz and If-TWM recoveries in time, frequency and STFT
Fig. 8 of the paper. Jazz and If-TWM: noise floor about 18 dB lower, finer spectral structure in the STFT of the reconstruction (a5, b5) than in the ADC's (a3, b3).
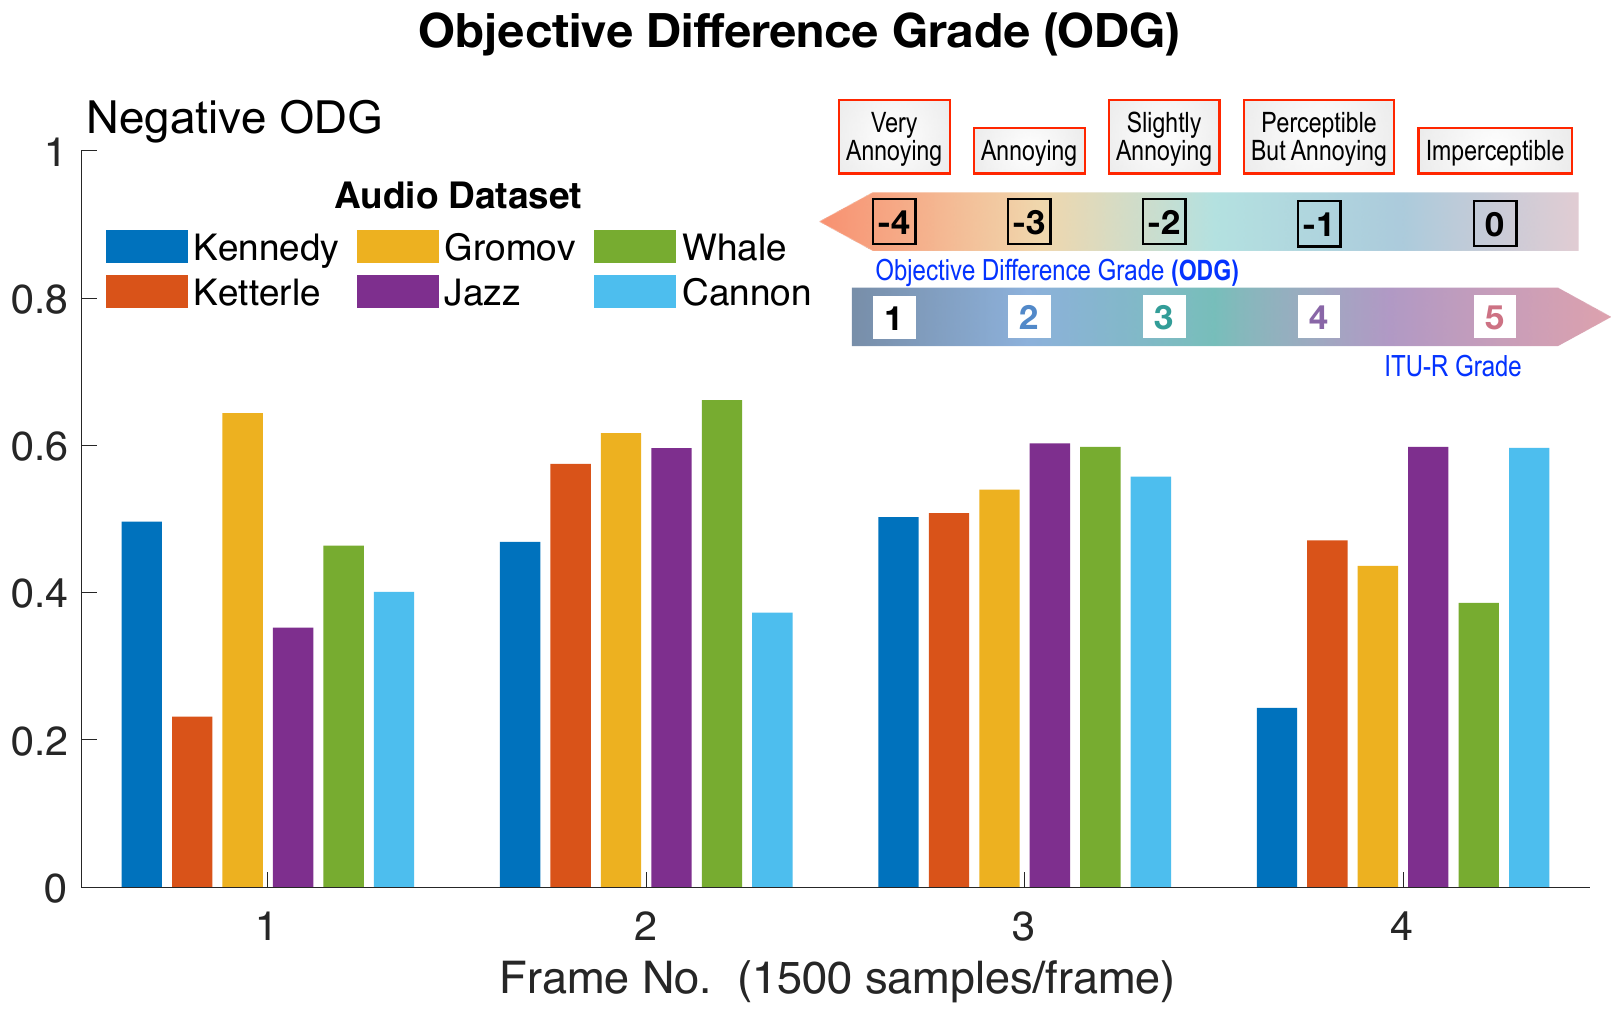
Fig. 7 of the paper: frame-wise objective difference grade for six datasets
Fig. 7 of the paper. Frame-wise PEAQ objective difference grade: average −0.4966, between “imperceptible” and “perceptible but not annoying.”
Evidence 3 · Table IV

Clipping Is Removed, Not Repaired

Restoration Under Severe Clipping

USF-Audio, hardware, 6 bitsstate of the art, best reported

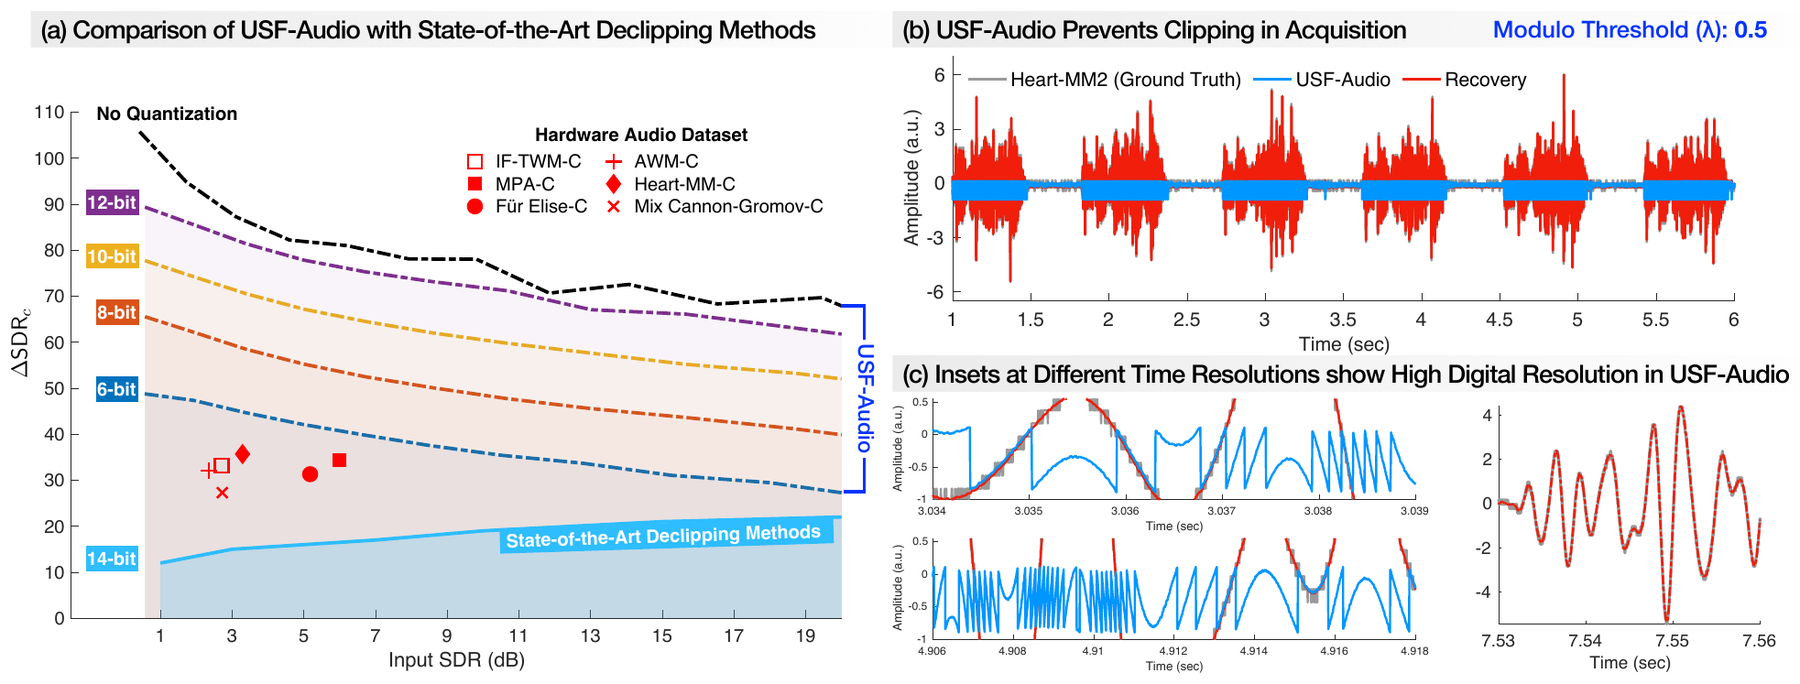
Fig. 6 of the paper: comparison with state-of-the-art declipping, and HDR recovery of a heart murmur
Fig. 6 of the paper. (a) Declipping methods plateau near a 20 dB ceiling, at best 11 dB under extreme clipping; USF-Audio stays above 30 dB. (b, c) A naturally HDR heart murmur, \(\norm{g}_\infty=6\), \(\lambda=0.5\): resolution 0.1977 (6-bit PCM) against 0.0051.
Evidence 4 · Fig. 10 and Table VII

What 52 Listeners Heard

Regime

ACR-MOS by Clip

conventionalUSF-Audioclipped

Participant Level

1

Resolution Without More Bits

At the same nominal 6 bits, ENOB rises by 1.5–2.4 bits and dynamic range by about 18 dB. No dithering, noise shaping or averaging is involved: the gain comes from how the converter's levels are spent, over \([-\lambda,\lambda]\) instead of the full range.

2

Theory Is an Upper Envelope

Measured noise-floor gains track \(20\log_{10}\DRX\) but fall a few decibels short. That gap is the cost of real folds and analog noise, which the ideal model ignores. The 14 recordings recover with zero failed frames out of nearly 70,000.

3

Perceptual Gain Where It Matters

Listeners prefer USF-Audio when acquisition is range-limited (6-bit hardware). With a high-bit digital control, 24-bit USF-Audio and 32-bit PCM are indistinguishable, so recovery adds no audible artifacts.
In the paper Section V: Tables II–VII, Figs. 4–10; ENOB \(=(\mathrm{SINAD}-1.76)/6.02\); listening protocol ITU-T P.800 ACR, two-sided Wilcoxon signed-rank tests with Holm correction.

All values are read from the paper's tables. Listening data: 52 participants × 10 clips × 3 conditions, scores mapped by \(y=1+4s/100\); violins are Gaussian kernel density estimates (bandwidth 0.25) of per-clip ratings; boxes show the mean with its 95% confidence interval (\(\pm1.96\,\mathrm{SD}/\sqrt{52}\)). Participant-level ΔMOS and \(d_z\) average each participant over the five clips of a regime. Data are anonymized: no participant identifiers are included.