


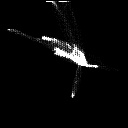
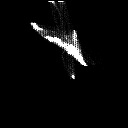
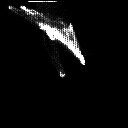
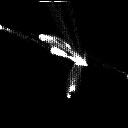
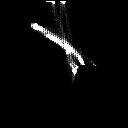
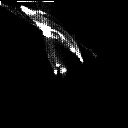
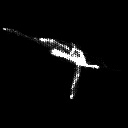
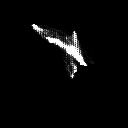
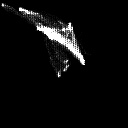
This shows the color histograms of the images after application of the color constancy algorithm in sensor space, compared with the original histograms. llumination. In these histograms, the color space is normalized red (R divided by R+G+B) and normalized blue (B divided by R+G+B). The vertical axis is red and the horizontal axis is blue.
Jump to just the images, without histograms.
| Gamut | Illuminant A | Illuminant B | Illuminant C |
|---|---|---|---|
| Original Image: All |
 |
 |
 |
| Corrected Image: All |
 |
 |
 |
| Original Image: Little Blue |
 |
 |
 |
| Corrected Image: Little Clue |
 |
 |
 |
| Original Image: Little Red |
 |
 |
 |
| Corrected Image: Little Red |
 |
 |
 |