


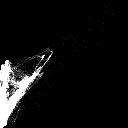
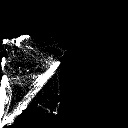
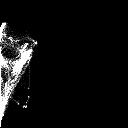
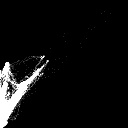
Here are histograms of the "red" sensor channel versus the "blue" sensor channel for the test images. The blue channel is represented along the horizontal axis, and the red channel along the vertical. The range of each channel is 0 to 255.
| Gamut | Illuminant A | Illuminant B | Illuminant C |
|---|---|---|---|
| All | 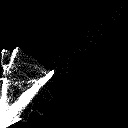 |
 |
 |
| Little Blue |
 |
 |
 |
| Little Red |
 |
 |
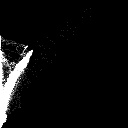 |
Histograms of the original test images chromaticity space (instead of this sensor space) are also available.