


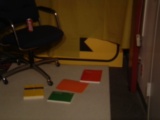
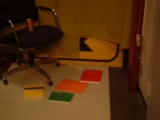
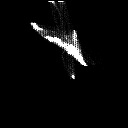
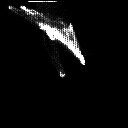
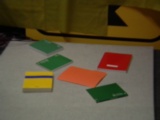
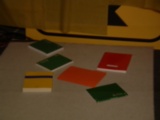
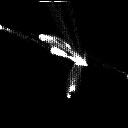
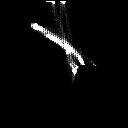
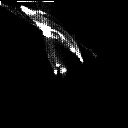
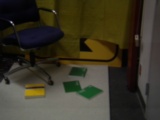
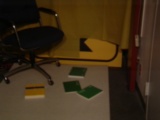
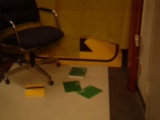
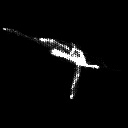
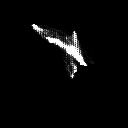
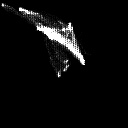
The experimental data consists of (basically) the same scene, under three different conditions of illumination. Two dimensional histograms showing the different sensor data obtained for each scene are below. In these, the color space is normalized red (R divided by R+G+B) and normalized blue (B divided by R+G+B).
The red channel is represented along the vertical axis, and the blue channel along the horizontal. The range of the horizontal (blue) channel is -128 to 64, and the range of the vertical (red) channel is -64 to 64.
| Gamut | Illuminant A | Illuminant B | Illuminant C |
|---|---|---|---|
| All | 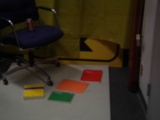 |
 |
 |
| All | 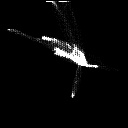 |
 |
 |
| Little Blue |
 |
 |
 |
| Little Blue |
 |
 |
 |
| Little Red |
 |
 |
 |
| Little Red |
 |
 |
 |
Histograms in sensor space (instead of this chromaticity space) are also available.