 |
NOTE: this is an HTML formatted version of the paper. Please go to the paper's homepage for more printer-friendly formats.
Nelson Minar
MIT Media Lab E15-305 20 Ames
Street Cambridge, MA 02139 USA
<nelson@media.mit.edu>
http://www.media.mit.edu/~nelson/
December 9, 1999
Data and software from this survey is online at http://www.media.mit.edu/~nelson/research/ntp-survey99/
Synchronizing clocks is an important and difficult problem in distributed systems. A simple example is that on the Internet, when someone gets an email or a web page he or she wants to know roughly when the document was written. Many distributed Internet applications require clocks synchronized to an offset of less than one second.
Since 1985 the Internet has had a well-known, wide-spread protocol for clock synchronization called NTP, the Network Time Protocol [4] [5]. The current version, NTP v3, has been in use since 1992. NTP is able to synchronize clocks with sub-second accuracy across the entire Internet, managing errors from network delays and jitter.
This paper presents the results of a survey of the entire NTP network conducted November 21 - 28, 1999 from the host pinotnoir.media.mit.edu. The bulk of this paper is a description of the survey methods an an analysis of the collected data.
NTP has a hierarchical design for clock synchronization. At the top of the tree are the stratum 1 clocks, computers with some source of true time (typically a GPS or WWVB receiver). Other computers synchronize themselves over the network to the stratum 1 clocks, becoming stratum 2 clocks. The process repeats up to stratum 16, which is effectively infinity for NTP.
While hierarchical networks are usually implemented as a client/server relationship, NTP is actually a peer to peer protocol. Clocks are free to connect symmetrically; this is encouraged to provide redundancy and cross checking. Each NTP host chooses of its peers to set its clock to, called the synchronization peer. NTP's clock choices create a distributed minimum-weight spanning tree over the entire network. More details are in [4] and [5].
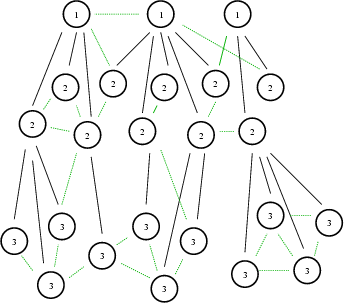
A schematic figure of the NTP network is presented in figure 1. This image is only suggestive, the real network is much larger and bushier.
The NTP network is semi-self-organizing: each node requires some manual configuration, but then runs itself. Each NTP host is set up by hand -- an administrator has to install it with a list of other hosts to peer with. Once the NTP host is set up it can run itself autonomously, making good choices about which of its peers to synchronize with. Many administrators set up an NTP host once and then never think about it again.
This paper takes a simplifying view of NTP, ignoring the presence of broadcast clients and the current NTP v4 efforts [6]. For the purposes of this paper the NTP network is a directed graph, where each node is a host and each edge is a peering relationship. These simplifications are reasonable -- broadcast clients tend to be on the edges, and NTP v4 is not yet standardized or widely deployed.
A note on terminology: the terms "host," "clock," "client," "server," and "peer" are used interchangeably in this paper to describe one computer time source running NTP. "Client," "server," and "peer" will be used preferentially to indicate the typical role of that NTP host. For example, stratum 1 hosts are often thought of as "servers," because they tend to have lots of other stratum 2 hosts that rely on them for time, although in fact they may themselves peer with other stratum 1 hosts, or even some of their own stratum 2 clients.
The most important data an NTP host maintains is its own notion of the current time. This time is provided to any of client that asks. Each host also maintains a list of peers, the other NTP hosts it queries for the time. For each peer the NTP host maintains several fields of information, most importantly the delay, offset, and dispersion of each peer. The delay is the amount of time it takes to communicate with the peer: this number is important for the accuracy of clock measurements. The offset is the difference between the peer's time and the host's own: the goal of an NTP host is to minimize its offset to its synchronization peer. The dispersion of a peer is an estimate on the error of the peer's clock: it accounts for several variables such as clock accuracy, network delay, and perceived drift. Finally, each host also calculates a its communication distance to the root time server (the true time source) and the dispersion of that root time: these measurements are useful for determining the final accuracy of a host's clock.
The core of the NTP protocol defines the mechanism for peers to ask each other for the time and thereby estimate delay, offset, and dispersion. NTP also has a sophisticated network monitoring facility: any cooperating NTP host can be asked information such as its current list of peers, its own state, etc. This monitoring facility is crucial to this survey. NTP provides a rare opportunity in being a large distributed system that is relatively easy to study.
The rest of this paper describes the survey and its results. Section 2 describes previous surveys, while section 3 describes the motivation behind this survey. Sections 4 and 5 describes the methodology and notes from experience. Results follow: section 6 presents an analysis of the size of the network, section 7 examines timing information, section 8 examines topological information, and section 9 focuses specifically on the stratum 1 clocks that provide time to the rest of the network. Finally, section 10 summarizes the results from this paper and suggests future work.
There is a small but accessible and active research community that works on NTP. Between the newsgroup comp.protocols.time.ntp and the web site http://www.ntp.org/, one can quickly come up to speed with the work of other NTP researchers.
This author is aware of three other major NTP surveys. The first was conducted by David Mills in 1989, when the NTP network was very small, only 1000 hosts [3]. This survey operated by scanning all known hosts on the Internet and focussed on the effectiveness of the NTP clock setting algorithms in the face of various errors.
James Guyton et al in 1994, performed a thorough survey of NTP by searching the NTP network itself through NTP diagnostic messages ("spidering" it, in Web terms), and presented a table of NTP hosts by stratum as well as numerical results about delays and dispersions seen in the network. In addition, they give an estimate the number of clients each host has as a coarse measure of the workload of each server.
Finally, Mills in 1997 again surveyed the NTP network, this time finding a much larger network [7]. In addition to size and timing statistics this survey tried to ascertain the "health" of the NTP network by measuring status codes and errors.
These three surveys (as well as a size estimate posted by Frank Kardel et al [2]) will be referred to throughout the data analysis, typically abbreviated by the first author's name and the year of the survey (ie: Guyton 94). Where possible, results have compared in order to understand the trend in the NTP network. The methods used in this paper for surveying and analyzing data draw heavily on this previous work.
Why survey the NTP network? A fundamental reason is the NTP network is important. As more distributed systems are built across the Internet, the quality of the Internet's time synchronization is becoming more significant.
Another reason to study the NTP network is that its semi-self-organizing property makes it quite interesting. Networks with low administrative overhead are highly desirable. Typical administrators do not maintain their NTP hosts very closely; NTP is specifically designed to make this safe and appropriate. How well has the NTP network held up with minimal care?
A final reason to study the NTP network is that it is possible. NTP is a remarkably established and stable protocol. It is also one of the larger distributed systems with a built-in network monitoring facility. This survey was able to query the status of over 175,000 hosts, a scale comparable to surveys of the World Wide Web and DNS.
The goal of this survey is to try to get a picture of the NTP network to understand what it currently looks like, how healthy it is, and how it compares to the findings of previous surveys. Some of the specific questions that motivate this survey are:
The survey was implemented by an "NTP spider" process that walked the graph of the NTP network, finding NTP hosts and querying them for information. Each host was asked for three pieces of information: its clock status, its list of peers, and its "monitor list," a list of the hosts that had contacted it recently. The peers and monitor lists yield information about the outgoing and incoming edges to each node in the graph. After each host was queried, the nodes on the other end of these edges were added to the list of hosts to be queried. By iterating this process the NTP network can be exhaustively explored.
The spider started on November 21 with a list of 207 well known public stratum 1 and stratum 2 servers. The list of candidates quickly grew as the spider discovered new hosts, finally ending with 647,401 hosts explored on November 28. The actual running time was about 100 hours as time was lost while the spider was rewritten to be more memory efficient.
The survey was conducted on a single Pentium-II computer running Red Hat Linux 6.0 and kernel 2.2.10. The host was connected via a standard 10 Mbps ethernet link to the LAN, which itself was connected via fast links to the MIT network and the Internet. The software used for querying was the xntpdc client from the xntp 3-5.93e distribution, in particular the Red Hat version xntp3-5.93-12. The query command run for each host was /usr/sbin/xntpdc -n -c sysinfo -c peers -c monlist <IPADDRESS>. The spider itself was 700 lines of homegrown Java software, available for inspection on the author's web site.
The survey as conducted has several limitations. The primary limitation is that queries were made by xntpdc which uses private-use mode 7 NTP queries that are not standardized. However, it appears that a very large percentage of the NTP hosts on the network do understand these queries. Another limitation is that the survey was only conducted once from one Internet host. Because NTP is a UDP protocol, if there were network failures data might have been silently lost. No effort was made to distinguish between network outages and a host that was not actually running NTP. Finally, the spidering method employed here is limited in the network it can see. Hosts behind firewalls are largely invisible, and any networks completely disconnected from the initial root set will not be found. From the results found here the author believes this survey did actually account for a substantial portion of the NTP network.
Designing and running a survey of this magnitude is an interesting experience. One of the astonishing results is how easy it is. From a single PC the author was able to scan the entire Internet's timebase in a week! The survey code was fairly simple, written and tested in about a week. Data management was as simple as possible: one file per host, sorted into 256 directories by first quad of IP address. The robustness of the survey was greatly improved by designing the spider so that it could be stopped and restarted at any time and making sure that nothing ever erased data.
A major reason the survey was so easy to conduct is that NTP is a lightweight UDP protocol. In the best case, the spider only had to send three query packets to each host and collect replies. Naturally, avoiding DNS lookups on each host is important.
A major problem with this kind of survey is that many of the hosts (over 75%) do not respond either because they are behind firewalls, offline, or were never running NTP in the first place. The xntpdc client must wait for a timeout in these cases, a slow operation (5 seconds per query). The spider was implemented in Java to make multi-threading easy. Running 20 queries simultaneously resulted in the survey running just about 20 times faster.
As mentioned previously, it is fortunate that the NTP network contains such a wonderful survey facility. It seems prudent to design monitoring capabilities into all protocols designed for long-lived systems on the Internet.
However, most system administrators probably do not understand that this NTP data is available to anyone who asks. The author received about thirty emails from system administrators expressing concern that a strange computer was contacting their time servers. Many expressed concern that the survey was a scan for a new security hole. Fortunately, no one got too upset: administrators seemed satisfied with an explanation that the scan was part of network research.
Russell Fulton, one of the administrators who contacted MIT, had an excellent suggestion for notifying people of the intention of the scan. He recommended using DNS records to clearly label the scanning host. The idea is simple -- create a PTR record for the survey host with an obvious name such as ntp.netsurvey.mit.edu and then set up a web page there and at www.netsurvey.mit.edu explaining what is going on. This measure seems simple and prudent for anyone doing network surveys, for NTP or otherwise.
A final observation from the survey is that it is critical for researchers to release their data. This survey consumed many resources from the Internet. It is only proper that the results are contributed back to the community. In addition to this paper the raw data, some processed data, and the code itself are available for download at http://www.media.mit.edu/~nelson/research/ntp-survey99/. Another researcher might have a creative new way to interpret this data. And with luck, the data will persist online long enough that if someone else does a survey in five or ten years they can compare to these results.
The data accumulated in the survey amounts to over 500 megabytes of information, with many variables per host and a network of hosts in complex relationships. This paper aims to extract only the simplest aggregate statistics from this information, with a particular goal of reproducing previous survey results.
The first question to ask is "how big is the NTP network?" Answering this question exactly is impossible: hosts are hidden behind firewalls, change IP addresses, etc. This survey established a firm lower bound of 175,527 NTP hosts in the network: that is the count of hosts who responded to the NTP queries. Another size estimate is 647,401 hosts: that is the number of unique IP addresses the spider found and tried to test. The roughly 73% not counted for in the lower estimate are hosts that are either behind firewalls, or no longer run NTP, or do not answer xntpdc queries. In addition a large number of hosts do not run a regular NTP process but only set their time occasionally via single queries -- this survey can only indirectly count them as IP addresses that were seen.
|
Table 1 presents a list of network sizes taken over time. The size found in this survey is roughly 3.5 times larger than in Mills' study two years ago. The NTP network is clearly growing rapidly. Unfortunately there is not enough reliable data to fit any sort of function to it to see how the NTP network growth has paced the growth of the rest of the Internet.
The second question to answer is "what is the distribution of clocks by stratum?" As seen in the right column of table 2, the distribution is quite skewed, dominated by stratum 2, 3, and 4 clocks. It is hard to simply characterize the change in the distribution over time. All of the measurements show stratum 3 is the most common, which is consistent with a ypical NTP network setup (stratum 1 somewhere on the Internet, stratum 2 near the gateway for an organization, stratum 3 clocks on the LAN). This survey finds a relative increase in the lower strata clocks. This is most apparent at stratum 5 and 6, which now accounts for a noticeable fraction of all hosts. This trend suggests that the NTP tree is getting deeper, not just bushier.
A second set of data to study is the timing statistics reported by NTP. NTP's accuracy is entirely dependent on the ability to accurately measure the other clocks in the network: this in turn depends on network delays, clock jitter, etc. These factors are summed up in the measure of delays and dispersions of clocks. In addition, the offset between two clocks is a useful measure to indicate how well NTP hosts converge over time. These numbers can be measured in two ways: the direct value to the synchronization peer, or the estimated value to the root time.
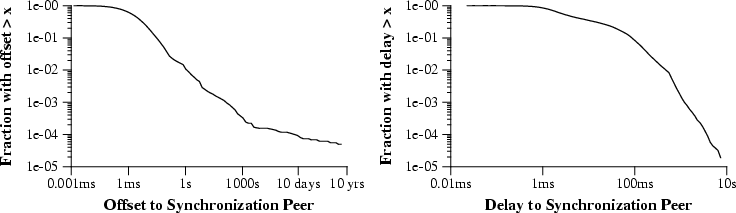
The first data to measure is the offset from each host to its synchronization peer. Ideally this number converges to zero, but does so slowly so as not to change the system time too rapidly. The offset typically never actually reaches 0 because of inaccuracies in the timing measurements: the time is a moving target. An added complication is that if the offset reaches 128ms, NTP refuses to synchronize the clock to that peer, so sometimes once two clocks diverge too much they never come back together. This slip should not happen in normal practice.
The left side of figure 2 presents the distribution of offsets to peers for all 175,000 surveyed hosts. This graph is a log/log plot of the cumulative distribution function (CDF) of the data. This type of graph will be used throughout the paper to characterize distributions. The Y axis shows the fraction of hosts whose value is greater than its position on the X axis. For example, only 10% of the hosts have an offset more than 20ms, and only 1% have offset greater than 1s. The 128ms discontinuity is clearly visible in the graph. In addition there is a very long tail where a small but persistent portion of hosts are very far off from the correct time.
The shape of this curve is similar to that presented in Mills' 1990 and 1997 surveys. However, the whole distribution has shifted to the left towards shorter offsets. There is also a longer tail, suggesting a small but noticeable fraction of hosts that have pathologically incorrect clocks (1 in 1000 are over 100 seconds off!).
Nearly 3% of the hosts surveyed have offsets greater than 128ms and are therefore no longer being effectively synchronized by NTP. Eliminating those, the remaining hosts have a mean offset of 8.2ms, median 1.8ms, standard deviation 18ms. This is a substantial improvement over Mills' 1997 finding of mean 28.7ms and median 20.1ms. Perhaps operating system support for clock slewing has improved or the NTP network as a whole has just become more accurate.
A second thing to measure is the network delay to the synchronization peer, depicted on the right side of figure 2. Surprisingly, more than 10% of the hosts are more than 100ms from their synchronization peer, suggesting a substantial fraction of NTP hosts are synchronizing over a WAN. The shape of the distribution is roughly comparable to that from Mills' 1997 survey, again shifted toward lower delays. However, the curve is much more gentle: the "elbow" is not nearly as sharp. It is unclear how to interpret this difference.
Quantitatively, hosts have a mean delay of 33ms, median 32ms, standard deviation 115ms. This shows quite an improvement from the 1997 survey's discovery of a mean delay of 186ms, median 118ms. This change could indicate a general improvement in the latency of the Internet, but could also be explained by changes in the NTP topology.
| |||||||||||||||||||||||||||||||||||
To gain a bit more insight into the delays seen by NTP hosts, it is useful to break up the statistics by stratum as in table 3. It is apparent that high delays are largely seen by hosts talking to stratum 1 clocks, consistent with the idea that stratum 2 hosts generally talk over a WAN to stratum 1 clocks. Delays for the rest of the table are quite short and are consistent with mostly LAN links. This data suggests that the NTP topology is generally what one would expect: high latency WAN links to the relatively rare stratum 1 clocks, and then low latency links for the rest of the network.
This pattern also held in Guyton's 1994 survey, suggesting that in general the NTP topology by stratum has not changed significantly. There is an across-the board improvement in delay since 1994, implying that the NTP delay improvement of the past few years is because the network infrastructure has improved, not because the NTP server network topology has changed. However, the standard deviation of delay has actually increased! Perhaps there is a wider variance of link types in use now in the NTP network.
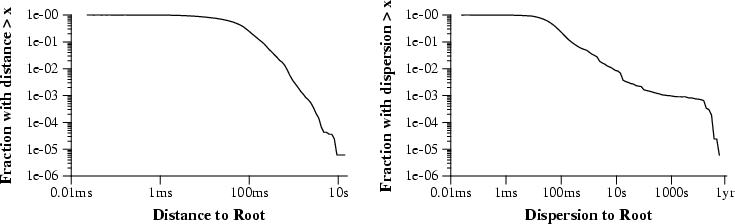
A second set of timing measures that can be taken are measurements to the root time server that any particular host ultimately is synchronized to. This data is not necessarily perfect, for each host does not talk directly to the stratum 1 host. But it is a useful measure of the overall accuracy of any clock. Two measurements are available: distance (delay) and dispersion (error).
The survey uncovered a mean distance to the root time server of 84ms, median 47ms, standard deviation 156ms. Guyton 94 found average distances to root of roughly 150ms (standard deviation 170ms). By this metric, the NTP network has gotten twice as fast in the past five years. Because accuracy is directly related to delay, this is a substantial improvement.
The CDF of distances on the left of figure 3 suggests that most hosts are some distance from the root. Very few are under 10ms delay, which is to be expected as almost all stratum 1 clocks are a WAN hop away. The distribution falls off quite quickly around 100ms; almost all hosts are less than 1 second away from the root time server.
The dispersion to root is important as it gives an estimate of the error of each clock. The distribution on the right of figure 3 is quite odd: there is a drop-off around 100ms, but then a very few outliers out to one year. There is some measurable fraction of clocks that have pathologically bad timekeeping.
Because of these outliers, the mean dispersion for the whole dataset is not meaningful (16 seconds!). Cutting off the last 3% (as was done for peer offsets), the mean dispersion is 88ms, median 39ms, standard deviation 175ms. Guyton 94 found a mean root dispersion of roughly 150ms, standard deviation 250ms. These changes confirm that timekeeping accuracy has improved substantially in the past five years.
The NTP network is quite large. The strata information suggests the network is a fairly bushy tree. How well balanced is it? How much work do servers have to do?
|
A simple way to estimate the load on NTP hosts is to take the number of servers at stratum n and divide by servers at stratum n+1. This measure is simplistic, only telling roughly how many clients there are per server higher stratum, but it is easy to calculate as shown in table 4. It is clear that the stratum 1 servers have an unfair share of the burden and that it is only getting worse.
This average analysis is only a very coarse approximation of the branching factor. In reality hosts typically peer to several other servers, and some well-known servers are much busier than others. NTP hosts do not maintain an accurate list of who peers with them (the monitor list data is incomplete), but with a full table one can work backwards asking which servers each host peers with, to discover how many clients any particular server has.
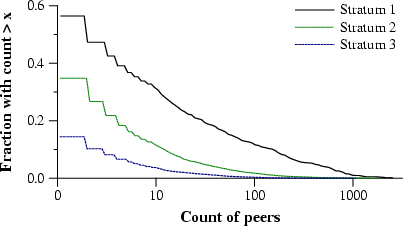
Figure 4 shows the CDF of the count of peers per host for strata 1-3. Note: the X axis is log scale, the Y axis is not. For instance, about 30% of the stratum 1 clocks serve time to 10 or more hosts, while only 12% of the stratum 2 clocks have 10 or more clients.
The first feature to note is how many hosts have very few peers: more than half of the stratum 2 clocks have at most one other peer! But the graph has a very slow decline: a fair number of hosts have a lot of peers. So while many hosts do not do much work, the hosts who do a lot of work seem to be somewhat evenly distributed.
The final feature to notice is that the curves are somewhat similar although the stratum 1 clocks do not appear to decline quite as quickly. This suggests a certain self-similarity in the branching factor of the networks that is worth investigating.
This data is only one way to estimate the load on a particular host: it measures the peering relationships between long-lived servers. Hosts can serve time in other fashions. For example, many clients do not run an NTP server at all but only connect to a time server once on startup: they will not be counted in this survey. The administrator of the well-known time server tick.usno.navy.mil estimates 531,370 unique IP addresses connecting over 16.6 days in the same month as this survey [personal email]. By contrast, this survey only found 2837 client who peered with that host. The true load on a well-known server is underestimated by this peering count.
Stratum 1 clocks are very important to the NTP network. They provide the authoritative time base for the rest of the Internet. And they are in short supply. A total of 957 stratum 1 clocks were found in this survey, considerably more than the 92 from the initial seed set from the public NTP server list. How many of these clocks are actually useful? Where do they get their time?
The survey uncovered 957 stratum 1 clocks that would respond to xntpdc queries. However, this overlooks some stratum 1 clocks that are not compatible with that query. By examining the peers listing of all the hosts from the survey, a few other clocks were discovered that were believed to be stratum 1. Adding these hosts in the new list yields a total of 1304 possible stratum 1 clocks.
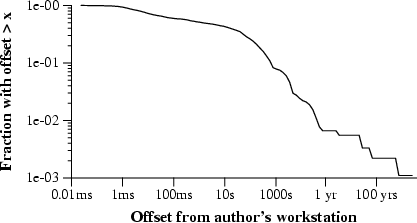
A second small survey was run on this list of 1304, in this case executing the ntpdate command to query them for the current time. This method is more complete than xntpdc, because it follows the standard NTP protocol. Of those 1304 candidates, 907 were still operating and claiming to be stratum 1.
The ntpdate survey captures the offset between each of these clocks and the author's well-synchronized stratum 4 workstation. The accuracy of the offset measures should be treated with some skepticism, as they were only measured from one host and only four samples were taken in a short amount of time. However, they are a reasonable estimate of the health of each stratum 1 clock. The distribution of offsets is shown in figure 5. A problem is clearly visible: while many of these stratum 1 clocks seem correct, a substantial fraction are much worse off. In fact, 391 of them have offsets of more than 10 seconds: they are almost certainly incorrect. What is the problem with these clocks?
Stratum 1 clocks set their time according to a reference clock. This clock has some external source of accurate time, for example a GPS receiver or a radio receiver tuned into WWVB broadcasts. Examining the survey data it is easy to construct table 5, a count of what reference clocks each stratum 1 host uses.
|
The most common reference clock by far is LCL. Ignoring those hosts for the moment, the rest of the stratum 1 hosts largely set their time to GPS receivers or a variety of radio receivers. The Internet's time comes from the sky. Mills in 1997 also surveyed primary reference clocks; since that survey, there seem to be fewer WWVB and DCF clocks in service and a growth in GPS clocks. Presumably this follows the increasing availability of low-cost GPS receivers.
The presence of the LCL drivers on so many stratum 1 clocks is alarming. This driver should only be used when a host has no better time source or peer and has to run independently. The xntp sources contain dire warnings not to use it in a situation where other people may try to synchronize to you, and by default it advertises a stratum of 3. Many people feel even stratum 3 is too optimistic -- why are these clocks advertising stratum 1?
Of the 391 supposedly stratum 1 clocks with bad time (over 10 seconds offset), 373 of them reported using LCL as their clock driver. Ie: the vast majority of bad clocks are misconfigured. Querying these servers further (via the command ntpq -c 'rv 0 processor,system,daemon_version'), we find that at least 300 are running a known bad installation of NTP from Red Hat. Red Hat Linux shipped a version of xntp with the LCL driver configured at stratum 0, causing exactly this problem. While this misconfiguration has since been fixed it seems to be the source of at least three quarters of the bad stratum 1 clocks on the Internet.
If bad configuration accounts for 373 of the bad stratum 1 clocks, what about the other 18? Inspection by hand turns up no obvious pattern. Several clocks listed their time source as GPS_NMEA. Other hosts list their source as CHU(1), reference ID LOCL. One of these was off by a spectacular six and a half years! Presumably each of these bad stratum 1 clocks has its own story. The moral is clear: beware when asking strangers for the time.
One way to estimate the damage these bad stratum 1 clocks are doing is to see how many hosts peer with them. Of the 175,000 hosts surveyed, only 729 peer with the bad clocks and only 157 selected a bad clock for synchronization. So despite the presence of bad stratum 1 hosts on the Internet the NTP network has managed to largely avoid being damaged by them. The relatively low number of peers suggests these bad clocks are not well known and the lower number of synchronizations implies that NTP's defenses against falsetickers work moderately well.
The extended survey found 1304 possible stratum 1 clocks. Of those, many have bad time: either through a misconfiguration of their reference driver or through some other unknown drift. Eliminating all known possible bad clocks we are left with a list of 363 hosts that seem to have time within one second of accurate time and have a reasonable reference clock. In 1997 Mills found 220 stratum 1 clocks. Assuming most of those were accurate, the number of useful stratum 1 clocks has roughly doubled while the number of total hosts has grown by a factor of four. Available stratum 1 clocks are still a scarce resource, and the situation is not getting better.
This survey has captured the state of the NTP network in November 1999. The network is growing rapidly and seems to be managing reasonably well. Timing statistics suggest that delays and accuracies have improved over the years, helping clock accuracy for everyone. This survey uncovers two problems: the number of bad clocks on the network, and the unbalanced nature of the network load.
The number of bad clocks was a truly surprising result. Only 28% of the stratum 1 clocks found appear to actually be useful. Fortunately, the worst stratum 1 clocks do not seem to have many peers. Another problem is that some 3% of hosts are more than 128ms from their peers and are therefore not being properly synchronized. Perhaps future versions of the NTP protocol or implementation can address this issue.
Load allocation in the NTP network is not terrible. The most popular clock servers are quite busy but there are a fair number of them that share the work. The main problem is the large number of stratum 2 servers depending on relatively few stratum 1 servers. It would be good to have more of these stratum 2 clocks peer with each other, dropping some to stratum 3 and spreading the load. But that change will have to be done carefully so the extra WAN links do not cause more network-induced dispersion.
An alternate solution is to encourage the deployment of more stratum 1 clocks, perhaps by bundling an inexpensive receiver into a turnkey system. But the most interesting and scalable solution is changing NTP so the network balances itself more efficiently, becomes more self-maintaining. The current work on NTP v4 [6] should help the situation considerably. NTP v4's multicast mode extends NTP broadcast so that a server can efficiently service many clients. And the manycast mode will allow clients to easily find nearby time servers automatically, eliminating the need for people to configure peer lists by hand and hopefully allowing the network to automatically balance its own load. NTP v3 has held up remarkably well over the past seven years, and the proposed changes in NTP v4 will allow it to run better in the future.
The current survey data contains a wealth of other information that has not been explored in this paper. Interesting results that could still be extracted include more details of the network topology, the effectiveness of redundant peering relationships between clocks, and the impact that the few most popular stratum 1 servers have on the entire network's time base. It may also be possible to examine the present data to determine if the bulk of the NTP network is synchronized to the same time, or if there are two or more large clusters that are off by several milliseconds.
Finally, future surveys will continue to be of value in monitoring the NTP network. Longitudinal studies allow us to monitor the health of the NTP network. And NTP provides a good, easily studied example of a large, semi-self-organizing network built on top of the Internet. Intuitions from NTP can ultimately be applied to the performance of other distributed Internet systems.
This document was generated using the LaTeX2HTML translator Version 98.2 beta6 (August 14th, 1998)
Copyright © 1993, 1994, 1995, 1996,
Nikos Drakos,
Computer Based Learning Unit, University of Leeds.
Copyright © 1997, 1998,
Ross Moore,
Mathematics Department, Macquarie University, Sydney.
The command line arguments were:
latex2html paper
The translation was initiated by Nelson Minar on 1999-12-09