

Next: The Expanded Program
Up: Q ISA
Previous: Primitive Tasks
Index
An Example Program

An Example Program
A simple program illustrating the use of the Q instruction set
architecture may be represented by the dataflow graph in Fig. 4. This program inputs an image from a file, and
outputs a single level of a gaussian pyramid decomposition of the
image. This is a repeated filtering and downsampling along both
image dimensions.
Assuming an image size of  for the zeroeth level (the
input image), the first level of the pyramid will have a size of
 , with succeeding levels having sizes of
 ,
,
 , etc...

The Decompose Graph
In the dataflow graphs, circles are used to represent streams, and
rectangles represent tasks, usually labeled with the name of the
function they apply. The Decompose function, which calculates
a particular level of the pyramid, may be described by the dataflow
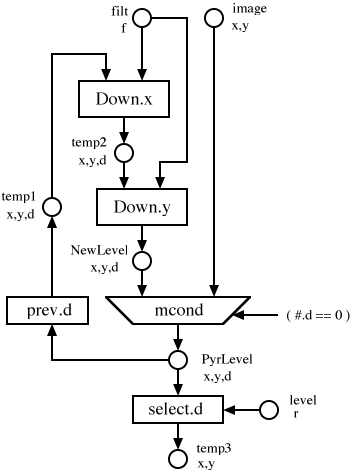
graph shown in Fig. 5. The Decompose
graph is shown in Fig. 5. It applies the
Down function along each spatial dimension at each level to
generate the next level of the pyramid.
A text version of this program is shown in Fig. 6,
written in the Q language described in Appendix A.
There are four dimensions declared. The first two (x and
y represent the spatial dimensions of the image. The third
(f) represents filter coefficients, and the c
dimensions spans the characters in a filename.
Five streams are declared at the top level of the program. Two of
these represent the images being input and output, and only span the
image spatial dimensions. The third, gaussian, represents
the filter being used for decomposition and is statically initialized.
It only spans the filter coefficient dimension. The last two streams,
InFile and OutFile represent the names of the files
used for input and output.
Figure 4:
An Example Program
 |
The Decompose graph declares one internal dimension, d,
which represents a level within the gaussian pyramid. The
Output is defined as being the input image at position zero
along the d dimension, followed (at higher positions along
d) by a decomposition of the previous image along
d8.
The Down graph, shown in Fig. 7 separably
filters then decimates the image along each of the spatial
dimensions9.

The Down Graph
The filt1D function is declared at the top level, but not
defined at this time. It represents a Q sequential function in this
program.
Footnotes
- ...d8
- The fby operator can be confusing. It
is important to remember that the second term is evaluated at the
current position along the dimension to yield the next value along the
dimension.
- ...
dimensions9
- While this separable filter does not exactly
implement a two-dimensional gaussian filter, this is a common image
processing optimization. More importantly, it allows me to show a
one-dimensional filter routine being applied along different
dimensions.
Subsections


Next: The Expanded Program
Up: Q ISA
Previous: Primitive Tasks
Index
magiceight-web@media.mit.edu


