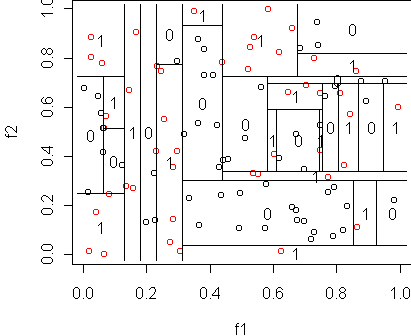
# make the dataset
n <- 100
y <- factor(sample(c(0,1),n,replace=T))
x <- data.frame(f1=runif(n),f2=runif(n),y=y)

tr <- tree(y~.,x,minsize=1)
cplot(tr)
misclass.tree(tr)
x <- rsplit(x,0.5)
names(x) <- c("train","test")
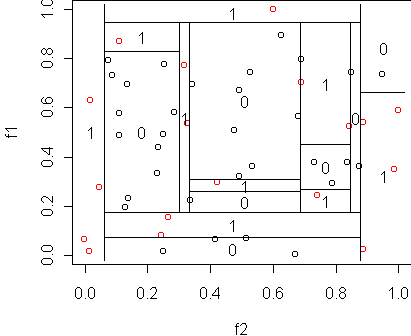
tr <- tree(y~.,x$train,minsize=1)
cplot(tr)
misclass.tree(tr)
misclass.tree(tr,x$test)The result is 24 errors out of 50, for an error rate of 0.48. This is much closer to the truth, which we know is 0.5. A full confidence interval on the error can be obtained in the usual way:
nx <- misclass.tree(tr,x$test)
n <- nrow(x$test)
p <- nx/n
se <- sqrt(p*(1-p)/n)
z <- 1.96
cat("Error rate is in (",p-z*se,",",p+z*se,") with 95% probability\n")
x <- read.table("ex20.dat")
tr <- tree(y~.,x)
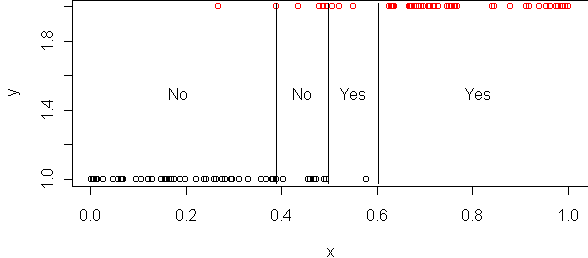
cplot(tr)
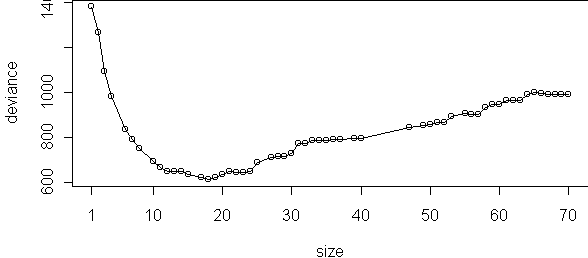
plot(cv.tree(tr),type="o")
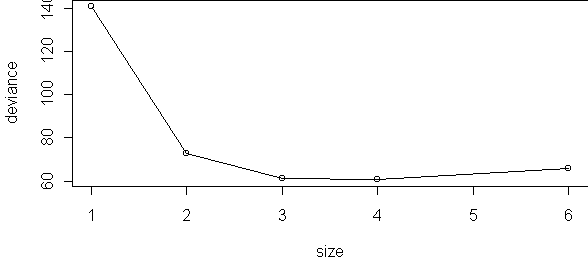
cv.tree uses 10 blocks by default, so for each of these six sizes 10 trees were trained, for a total of 60 trees to make this plot. The performance measure used here is deviance, not misclassification. Deviance is the log-probability of the data, multiplied by -2. It is similar to misclassification except it includes the confidence that the tree makes in its classifications. A tree which is confident when it is right and not confident when it is wrong will have low deviance.
Since 4 leaves appears best, we could regrow the tree and stop when there are 4 leaves. Equivalently, we can run the tree growing procedure backwards, by merging leaves instead of splitting them. This is called pruning and is done by prune.tree:
tr2 <- prune.tree(tr,best=4)
cplot(tr2)
Both cross-validation and pruning can be done in one step via the routine best.size.tree:
tr2 <- best.size.tree(tr,10)The second argument is the number of blocks to use for cross-validation, which defaults to 10.
x <- rsplit(churn,0.5)
names(x) <- c("train","test")
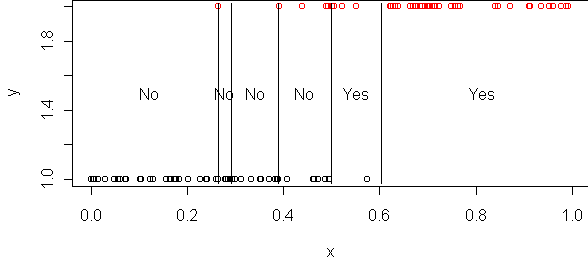
tr <- tree(churn~.,x$train,mindev=0)
plot(tr,type="uniform"); text(tr,pretty=0)
misclass.tree(tr)
# misclass of all prunings
p <- prune.tree(tr)
plot(p,type="o")
tr2 <- best.size.tree(tr)
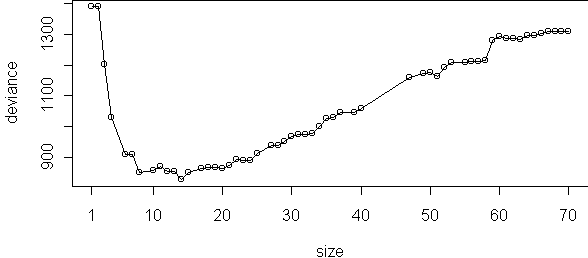
p <- prune.tree(tr,newdata=x$test)
plot(p,type="o")
cat("best size on test is",p$size[which.min(p$dev)],"leaves\n")