
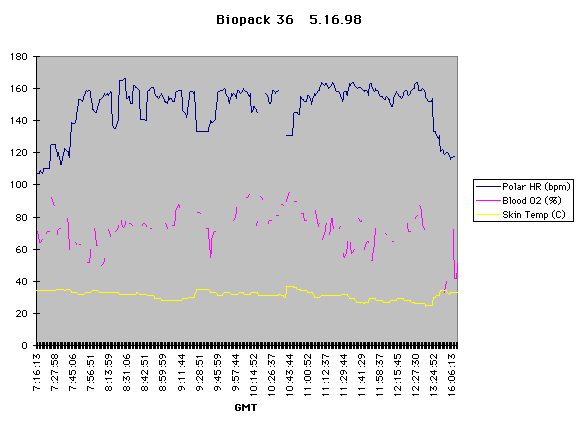
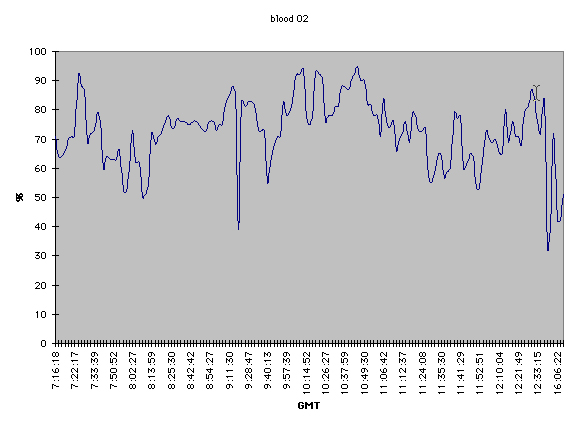
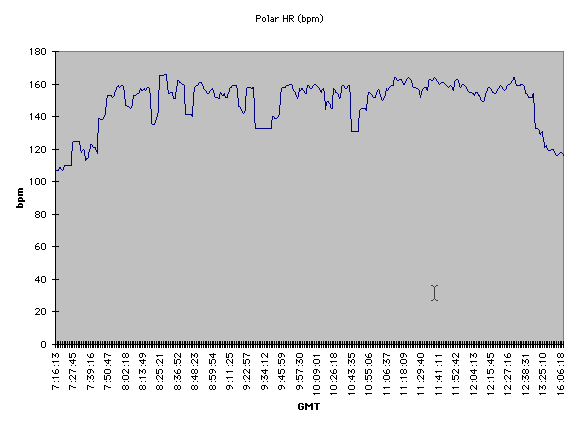
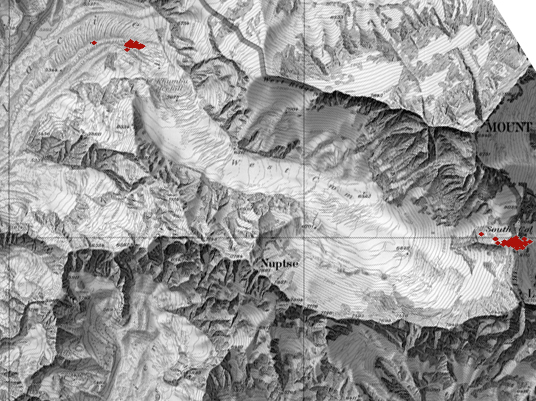
The following graphs detail the data that was captured from a single Geo-pack and a single Bio-pack on May 16th (prior to summit day). The Bio-pack data is data that was received wirelessly. The Geo-pack data is comprised of data that was received wirelessly on the first day (5/16) and GPS data that was recovered from the pack's logs for 2 subsequent days. Hopefully more data will be available when the Bio-pack units are recovered and their logs are examined.
|

|
sample lines:16 May 1998 07:16:13 GMT 895299373920 00 127 107 034 16 May 1998 07:16:18 GMT 895299378528 71 045 107 034 16 May 1998 07:16:23 GMT 895299383136 64 005 107 034 16 May 1998 07:16:27 GMT 895299387744 64 037 109 034to read (using the top line as an example):
date/time (at GMT) Milliseconds since 1970 Blood O2 (%) Heart Rate as measured by Nonin Blood O2 sensor (beats/minute) Heart Rate as measured by Polar Heart Rate Monitor (beats/minute) Skin Temperature (degrees C)
sample lines:16 May 1998 06:07:12 GMT 895295232000 086.8620832 28.0065354 000 54 144 -025 16 May 1998 06:14:19 GMT 895295659000 086.8639831 28.0068434 000 54 143 -025 16 May 1998 06:20:23 GMT 895296023000 086.8617947 28.0065148 000 54 131 -025 16 May 1998 06:26:54 GMT 895296414000 086.8619410 28.0067762 000 53 132 -025to read (using the top line as an example):
date/time (at GMT) Milliseconds since 1970 Longitude (degrees) Latitude (degrees) Humidity (sensor disabled) Barometric Pressure (kPa) Light (0 = dark, 255 = light) Temperature (degrees C)
home - technology