Modeling Musical Tension |
||||
|
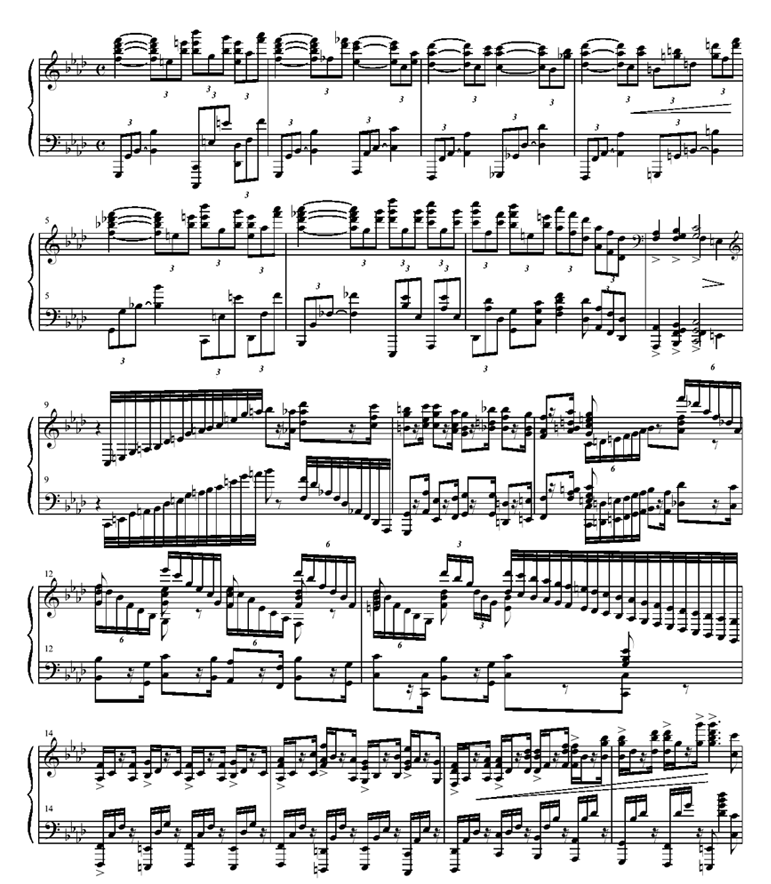
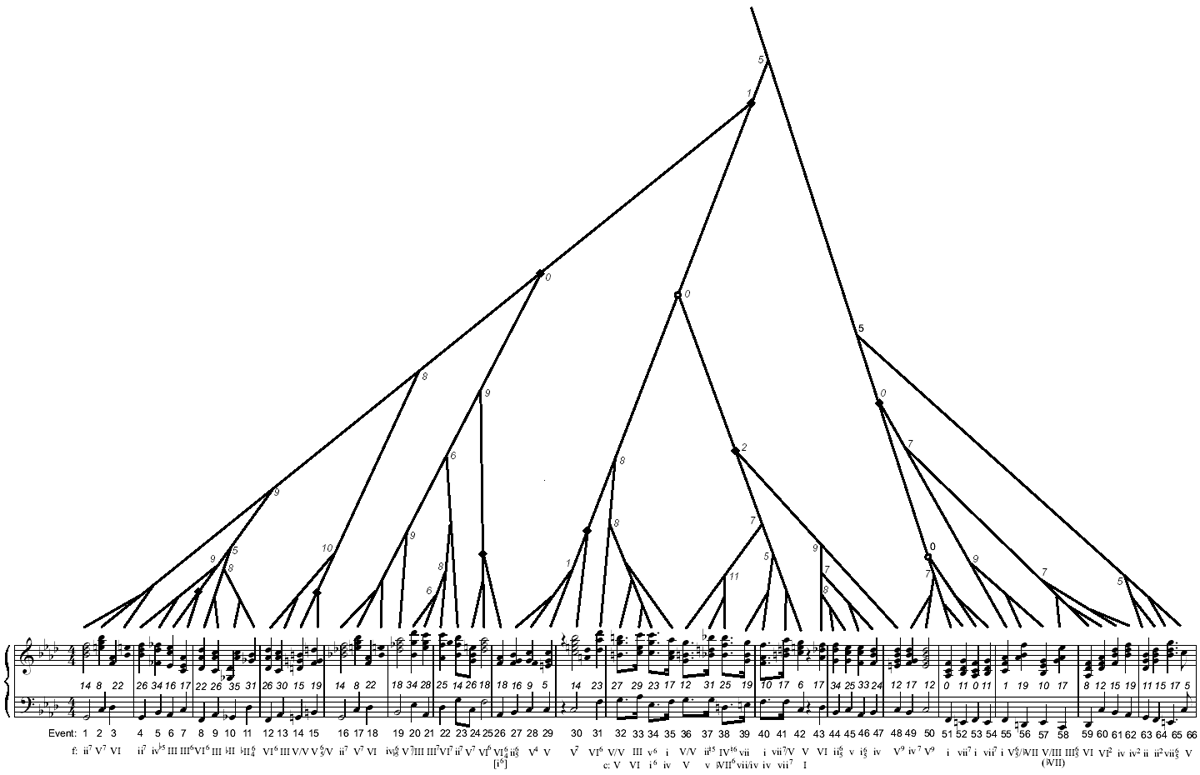
The concept of musical tension is a complex phenomenon that is evident to listeners yet hard to describe formally. In qualitative terms, an increase in tension can be described as a feeling of building excitement or impending climax, or an increase in uncertainty, while decreasing tension can be described as a feeling of relaxation, resolution, or fulfillment. The goal of this work is the implementation of a quantitative, parametric model for describing musical tension. The model is based completely on empirical data and takes into account multiple, disparate musical features including melodic contour, harmony, onset frequency, tempo variations, rhythmic regularity, and dynamics. AnalysesThe musical excerpts used to build the tension model were analyzed and described according to each of the parameters in question. In the case of the one-dimensional features such as tempo and onset frequency, the descriptions were straightforward. Multi-dimensional features such as harmony required quantitative descriptions produced by other theoretical models (in the case of harmony, Lerdahl's tonal tension model). Below are images of all the feature descriptor graphs for one of the musical excerpts, a passage taken from Brahm's Piano Concerto No. 2. |
 Screenshot showing tension data for the opening of Beethoven's First Symphony. |
|||

Excerpt from Brahms Piano Concerto No. 2, First movement

Graph showing onset frequency values over time.

Graph showing pitch height.

Harmonic tension graph. The x-axis represents time, and the y-axis, tension values.

Prolongational reduction (as described by Lerdahl's generative theory of tonal music) used to calculate harmonic tension values.

Melodic expectation graph.

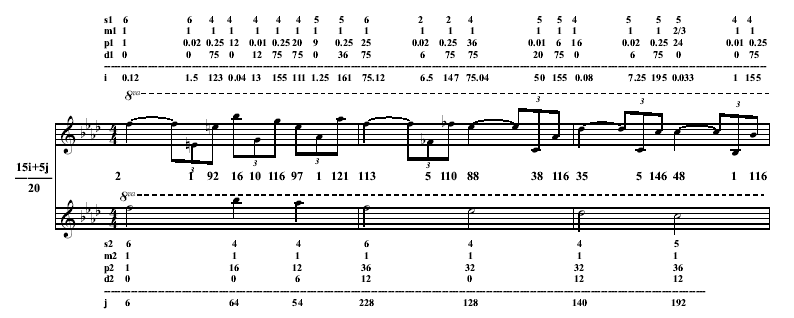
First line of analysis showing how melodic expectation values are calculated (based on Margulis' melodic expectation model). i values consist of direct note-to-note level expectations, and j values consist of high-level patterns based on salience and metrical placement. s represents stability ratings, m represents mobility ratings, p represents proximity ratings, and d represents direction ratings. The values between the two staves are the final melodic expectations ratings for each note.

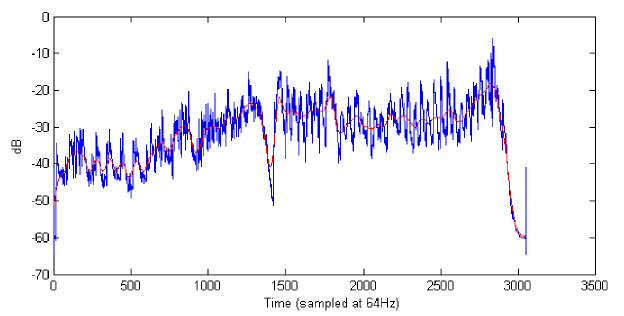
Loudness curve. The blue line is the perceived loudness in dB produced by Jehan's psychoacoustic model, and the red line is the smoothed version used for the feature graph in the analysis of Experiment 2.
[Home]
6f772049 20646c75 656b696c 206f7420
656b6174 77206120 206b6c61 74206e6f
42206568 6b6f6f72 206e796c 64697242
77206567 20687469 20656874 20656e6f
6f6c2049 0a2e6576 75656845 67756620
73656361 62616c20 75746e75 6e612072
202e696e 6f540a20 20796d20 74756f79
61202c68 61206576 65757174 6c617620
000a2e65
Last modified: 2 January 2007