syn.thet.ic \sin-'thet-ik\ [Gk synthetikos of composition, component, fr. syntithenai to put together] : devised, arranged, or fabricated for special situations to imitate or replace usual realities.
syn.es.the.sia \.sin-*s-'the--zh(e--}\ [NL, fr. syn-esthesia (as in anesthesia)] : a subjective sensation or image of a sense (as of color) other than the one (as of sound) being stimulated.
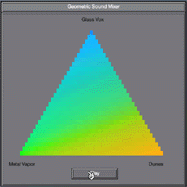
A simple geometric shape (triangle, square, pentagon, etc.), called the Geometric Sound Mixer (GSM), is used to mix sounds. Timbre is represented as color within the GSM; the relative amount of each sound source is represented as a mix of colors, each one associated with a unique timber. A static representation of any dynamic sound mix (as it evolves over time) can be viewed on the Mix Time Line (see figure below), where relative moment-to-moment audio levels control the brightness as the sounds play in real time. Perceptually linear audio and color mixes are achieved using psychophysical functions. The result is an environment that allows for complex manipulations of sound in a highly simplified, structured environment.
Thórisson, K. R. & Donoghue, K. (1993). Synthetic Synaesthesia: Mixing Sound with Color. InterChi Adjunct Proceedings, 65-66. [PDF]


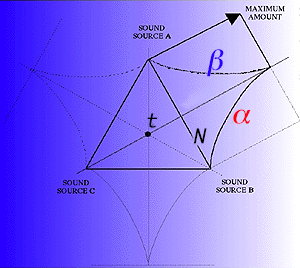
The left image shows a triangle Geometric Sound Mixer with one sound attached to each corner, each with a different color (green, blue and orange). The relative amplitude of each sound falls off along the sides of the GSM according to the psychophysical function of perceived auditory loudness (graph). Curves alpha and beta show how SOUND A and SOUND B fall off along their mutual side N of the GSM, respectively, according to the function  , where I is physical intensity, L is apparent loudness and k is a constant. All sounds are at equal loudness at point t.

In this figure the Mix Time-Line shows (a static view of) the amplitude envelope of the three sounds above by varying the brightness of their colors (this display synchronizes in real-time with the audio when played). A color's brightness is determined by linearizing the amplitude of the corresponding sound (according to the above equation) and then using a psychophysically scaled color space (Munsell) to get a direct linear mapping between color brightness and amplitude. The net effect is that by a quick glance at the Mix Time-Line you should be able to "listen with our eyes" for how loud the sounds are at any point in time, and subsequently how their mix changes over time.