In this chapter, we present the results for the DFM synthesis method. Similarly to chapter 8, the results are given in tables (the various DFM parameters) and in bar-graphs (for spectral plots). The comparisons with FM synthesis (as for the case of AFM in chapter 8) are not done because the DFM operator is different from that of the FM and AFM operators : DFM does not have a carrier. Another reason is that only one DFM operator is used in all the DFM synthesized musical sounds and FM would not be able to produce comparable results with only one FM operator.
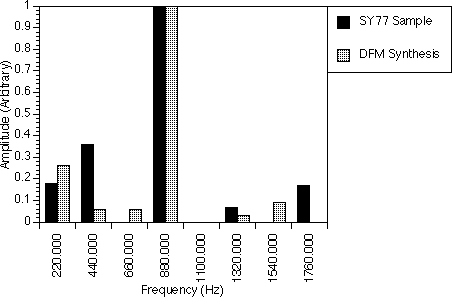
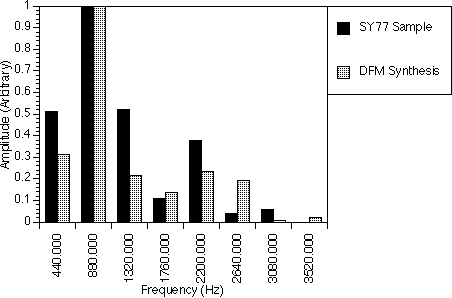
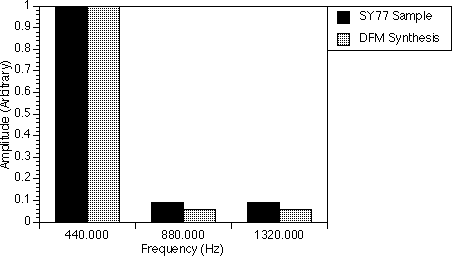
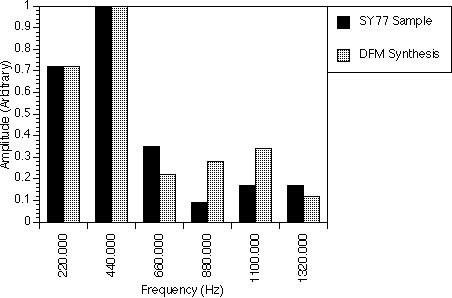
Tables 9.1 to 9.4 and figures 9.1 to 9.4, give the parameters for the DFM synthesis method and the spectra plots respectively for the musical instruments synthesized. The spectra were also normalized in the same way as those for the AFM synthesis method. All these were generated by only one DFM operator.
Pipe Organ
In figure 9.1, an attempt was made to synthesize the pipe organ spectrum at the pitch A3. Here, we have set the DFM parameters fm1 to 880.0 Hz and fm2 to 220.0 Hz with I1 and I2 equal to 1.4 and 0.5 respectively. In generating the spectrum of the pipe organ, we adjusted the indices such that the harmonic 1100.0 Hz is at a minimum. However, because we only used only one DFM operator, some other corrections like reducing the 660.0 Hz and 1540.0 Hz harmonics were not possible. Overall, the important harmonics, 220.0 Hz and 880.0 Hz, which make the synthesized wave sound like the pipe organ were still generated with comparable amplitudes as for the real instrument. With a second DFM operator, we could enhance the 440.0 Hz, 1320.0 Hz and 1760 Hz frequency components and diminish the 660.0 Hz and 1540.0 Hz frequency components such that the synthesized spectrum would match that of the real sample.
Soft Saxophone
The soft saxophone A2 note spectrum in figure 9.2 was generated with fm1 and fm2 set to 440.0 Hz and 880.0 Hz respectively. The indices were set to 1.2 for modulator 1 and to 2.0 for modulator 2. With these settings, we were able to generate the second, fourth harmonics quite accurately. For the first, third and fifth harmonics, we could able to achieve about half the amplitudes of the sample. With only one DFM operator, we can therefore achieve quite a good match to the spectrum of the real instrument. With a second DFM operator, we believe we could enhance the 440.0 Hz, 1320.0 Hz and 2200.0 Hz frequency components and diminish the 2640.0 Hz frequency component such that the resulting spectrum should match that of the real sample closely.
Piccolo
With only three harmonics, the spectrum of the piccolo A3 note in figure 9.3 could be generated very easily. Note that the second and third harmonics are quite similar in amplitude and they are also very small as compared to the fundamental. With the parameters listed in table 9.3, we were able to synthesize the spectrum with the second and third harmonics reaching almost the same amplitude as those of the real sample spectrum and with the 1760.0 Hz (not shown) component still almost zero. The DFM parameters I1 and I2 were set to 1.3 and 0.23 respectively and were obtained by trial and error method until the best possible spectrum was generated.
Horn
Table 9.4 and figure 9.4 show the DFM parameters and spectrum for the Horn A2 note. The first and second harmonics were generated very accurately while for the third and sixth harmonics, the amplitudes are more than half of the amplitude of the sample spectrum. Except for the 880.0 Hz and 1100.0 Hz components, they are larger than that for the sample spectrum. This is acceptable as the characteristic of the sound of the horn can still be heard. The DFM parameters I1 and I2 were set to 1.13 and 1.5 respectively and were obtained also by trial and error method until the best possible spectrum was generated.
With a second DFM operator, we believe the 660.0 Hz, 880.0 Hz, 1100.0 Hz and 1320.0 Hz frequency components could be corrected such that the generated spectrum could match those of the real sample closely.
Parameters
|
All
Portions
(DFM)
|
| A
(%)
|
100
|
| fm1
(Hz)
|
880.0
|
| I1
|
1.400
|
| fm2
(Hz)
|
220.0
|
| I2
|
0.500
|

Parameters
|
All
Portions
(DFM)
|
| A
(%)
|
100
|
| fm1
(Hz)
|
440.0
|
| I1
|
1.200
|
| fm2
(Hz)
|
880.0
|
| I2
|
2.000
|

Parameters
|
All
Portions
(DFM)
|
| A
(%)
|
100
|
| fm1
(Hz)
|
440.0
|
| I1
|
1.300
|
| fm2
(Hz)
|
880.0
|
| I2
|
0.230
|

Parameters
|
All
Portions
(DFM)
|
| A
(%)
|
100
|
| fm1
(Hz)
|
220.0
|
| I1
|
1.130
|
| fm2
(Hz)
|
440.0
|
| I2
|
1.500
|
