In order to test the practical feasibility of using AFM to synthesize musical instrument waveforms in real-time, we have synthesized a number of musical instrument waveforms using the procedures given in chapter 6. In this chapter, we present the results for each musical instrument synthesized. Their results are given in tables (the various AFM parameters) and in bar-graphs (for spectral plots). For comparison, we have also synthesized the instruments with normal FM synthesis.
The tables that follow list the various parameter values used during the synthesis of musical instruments with FM and AFM. The amplitude settings (e.g. A1, A2) are given as percentages. For example, 100 % means that the amplitude of the particular synthesis operator is set to 1.0 and 50 % means that the amplitude is set to 0.5. The first synthesis operator is always set to have 100 % amplitude and variation of the relative amplitudes of the two operators is performed by varying the amplitude of the second operator.
All the spectral plots are normalized by dividing the amplitudes of all harmonics by the amplitude of the harmonic that has the greatest amplitude. Each plot has the harmonics of the real SY77 sample spectrum plotted side by side with the corresponding synthesis spectrum so that comparisons between the two can be made easily. The legend of each of the spectrum plots is on the top right corner. The SY77 spectrum is always plotted as a solid black bar and the other spectra as shaded bars.
Musical instruments which have a spectrum change from attack to sustain have separate spectra plots for the attack portion, the attack-to-sustain portion and the sustain portion. The frequencies are based on the middle C3 note on the Yamaha SY77 synthesizer keyboard so that A3 has its fundamental frequency at 440.0 Hz.
Piano
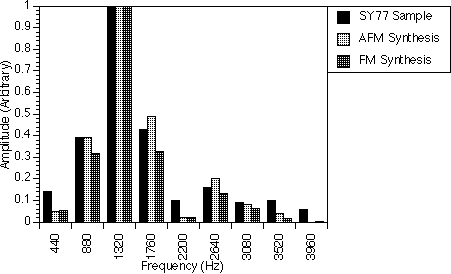
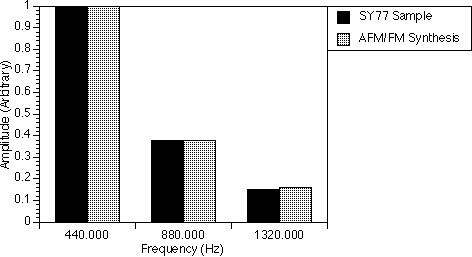
Figure 8.1 shows our attempt to synthesize the spectrum of the piano note A3. Here, we have used one AFM operator to generate the fundamental frequency 440.0 Hz, the third and the fifth harmonics. The second, fourth and sixth harmonics were generated by another AFM operator. The first AFM operator has r equal to 1.0, i.e. the special case of AFM which makes it equivalent to an FM operator. This is an example of mixed FM and AFM operators. The amplitude of each operator is controlled individually so that the synthesized spectra has the closest match to that of the real instrument.
Figures 8.1a,b and c show our attempt to synthesize the spectrum of the piano note A3 (table 8.1). Here, we have used one AFM operator to generate the fundamental frequency 440.0 Hz, the third and the fifth harmonics. The second, fourth and sixth harmonics were generated by another AFM operator. The first AFM operator has r equal to 1.0, i.e. the special case of AFM which makes it equivalent to an FM operator. This is an example of mixed FM and AFM operators. The amplitude of each operator is controlled individually so that the synthesized spectra has the closest match to that of the real instrument.
In figure 8.1a, where two FM operators were simply added together, we were not able to increase the sixth harmonic without increasing either the second and fourth harmonics or introducing higher harmonics. We were therefore forced to have a very small sixth harmonic which affects the timbre of the sound we want to generate. With AFM operators, however, we are able to overcome this problem with the use of the parameter r which was set to 2.7. The value of r here which is more than 1.0 allowed a shift in power from the lower harmonics ( i.e. 880.0 Hz and 1320.0 Hz ) to the higher harmonics. This raised the amplitude of the 2200.0 Hz frequency component slightly and the amplitude of the 2640.0 Hz frequency component (i.e. the sixth harmonic of this spectrum) to more than double as compared to when r was 1.0.
For the attack-to-sustain portion (figure 8.1b) and the sustain portion (figure 8.1c) of the piano note, the values of r for the AFM operators were set to 1.0, i.e. the AFM operators effectively became FM operators. The spectra for these portions are much simpler than the attack portion so the FM method alone is able to synthesize these spectra effectively.
Pipe Organ
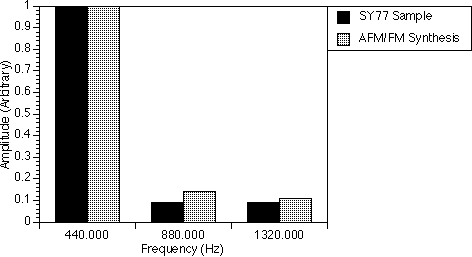
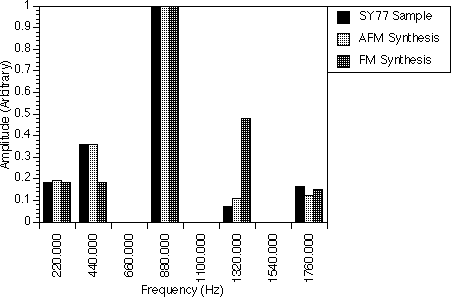
The pipe organ spectrum (table 8.2 and figure 8.2) was found to be one of the easiest instruments to synthesize. Here, only one AFM operator and a sine wave generator were used. The AFM operator was used to generate the second, fourth, sixth and eighth harmonics while the sine wave generator was set to the first harmonic. The sine wave generator was necessary because both the AFM and FM operators were not able to generate the 220.0 Hz frequency component with the carrier frequency fc set to 440.0 Hz and the modulator frequency fm set to 440.0 Hz.
Here, we have used the parameter r of AFM to shift the power of the harmonics to the left (r = 0.68 < 1.0) to achieve a spectrum that is very close to that of the real sample, i.e. the amplitudes of the 1760.0 Hz and 1320.0 Hz frequency components have diminished and the amplitude of the 440.0 Hz frequency component has increased. The sine wave generator is not changed so that the first harmonic did not change in amplitude.
If however, r = 1.0, i.e. AFM becomes FM, the spectrum generated is very different from the real sample. The 440.0 Hz frequency component becomes only half that of the real sample and the 1320.0 Hz frequency component becomes very large as compared to that of the real sample.
Soft Saxophone
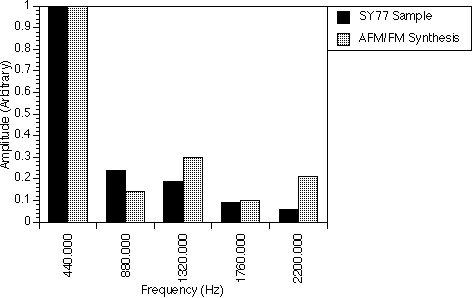
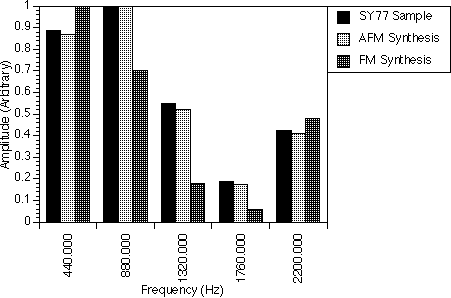
The soft saxophone spectrum (table 8.3 and figure 8.3) was also generated by one AFM operator and a sine wave generator. The AFM operator was set to generate all five harmonics and the sine wave generator was set to enhance the fifth harmonic (2200 Hz). The r parameter was set to 2.0 and was used to shift some of the power of the harmonics from the lower to the higher harmonics, i.e. decreasing the amplitude of the 440.0 Hz frequency component and increasing the amplitudes of the 880.0 Hz, 1320.0 Hz and 1760.0 Hz frequency components making the synthesized spectrum a good match to that of the real sample.
If an FM operator was used instead of the AFM operator to generate the soft saxophone spectrum (figure 8.3), the amplitude of the 440.0 Hz frequency component would be higher than that of the real sample and the amplitudes of the higher harmonics (e.g. 880 Hz and higher) would not be enough to match that of the real sample. The sine wave generator was also used in the FM operator case to enhance the fifth harmonic (2200.0 Hz).
Harp
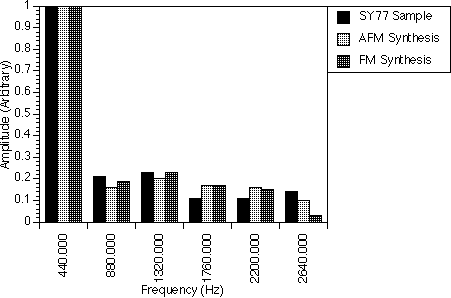
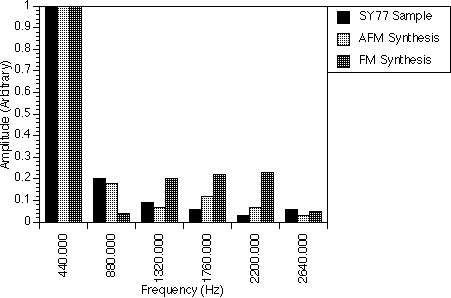
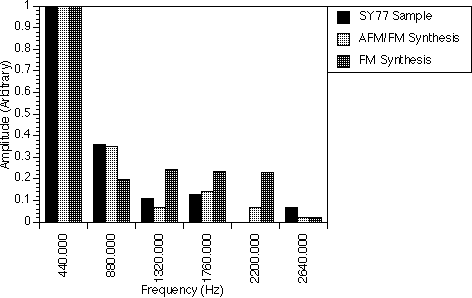
The attack portion of the Harp A3 note spectrum in figure 8.4a was generated by two AFM operators. The first AFM operator was used for all the harmonics while the second AFM operator at negative amplitude corrected the amplitudes of the second, fourth and sixth harmonics generated by the first operator. The second AFM operator had r equal to 1.0, i.e. it was effectively an FM operator. This is also another example of mixed FM and AFM synthesis operators.
If we used only the FM operators, the amplitudes of the 880.0 Hz frequency component would be very small and the amplitudes of the 1320.0 Hz, 1760.0 Hz and 2200.0 Hz frequency components would be very large as compared to those of the real sample. The parameter r which was set to 0.885, i.e. less than 1.0, has shifted the power of the higher harmonics down to the lower harmonics.
The attack-to-sustain portion of the Harp A3 note (figure 8.4b) was similarly generated with mixed FM and AFM operators. Here the parameter r of the first AFM operator was still set to 0.885. The second AFM operator which has r = 1.0, i.e. AFM becomes FM, has a different modulation index (I = 1.3) to correct the amplitudes of the second, fourth and sixth harmonics of the first AFM operator. The parameter r of the first AFM operator which was 0.885, i.e. less than 1.0, has shifted the power of the higher harmonics down to the lower harmonics. If only FM operators were used, the higher harmonics would be higher than those of the real sample. (The FM spectrum in figure 8.4b was generated by an FM spectrum generation program.)
The sustain portion (figure 8.4c), however, was generated with one FM operator and a sine wave generator. The sine wave generator was created by setting the modulation index of the second AFM operator to 0 (zero), i.e. turning off the modulator, and setting r to 1.0. The sine wave generator had a negative amplitude and was used to correct the amplitude of the second harmonic, i.e. the 880.0 Hz frequency component generated by the FM operator.
Tuba
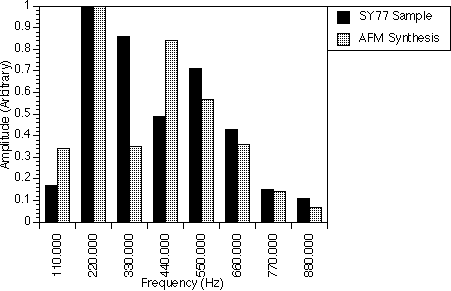
In figure 8.5, one AFM operator and one FM operator were used to synthesize the Tuba A1 spectrum. Both operators were set to generate all the harmonics and their outputs added together to form the final spectrum. All the harmonics generated except the first, third and fourth harmonics, match with those of the real sample. The first and fourth harmonics generated are larger than those of the real sample and the third harmonic is smaller than that of the real sample. The parameter r of the AFM operator was set to 1.10, i.e. more than 1.0, and this had shifted the power of the lower harmonics to the higher harmonics.
If we used only FM operators, the 100.0 Hz frequency component would be higher and the 330.0 Hz, 550.0 Hz and 660.0 Hz frequency components would be smaller.
Bassoon
This woodwind instrument, the bassoon in figure 8.6 (and table 8.6), required two AFM operators with one having its carrier frequency set to 1320.0 Hz and the other to 2640.0 Hz. Both AFM operators had the same modulator frequency of 440.0 Hz, i.e. both generated all the harmonics in this spectrum. With this addition of amplitudes of these two AFM operators, the second, fourth, sixth and seventh harmonics are generated with amplitudes that match those of the real sample. This is an example in which only AFM operators are used.
Parameters
|
Attack
(FM)
|
Attack
(AFM)
|
Attack
to Sustain
(AFM)
|
Sustain
(AFM)
|
| A1
(%)
|
100
|
100
|
100
|
100
|
| fc1
(Hz)
|
440.0
|
440.0
|
440.0
|
440.0
|
| fm1
(Hz)
|
880.0
|
880.0
|
880.0
|
880.0
|
| I1
|
1.200
|
2.200
|
2.360
|
1.650
|
| r1
|
-
|
1.000
|
1.000
|
1.000
|
| A2
(%)
|
40
|
22
|
23
|
18
|
| fc2
(Hz)
|
880.0
|
880.0
|
880.0
|
880.0
|
| fm2
(Hz)
|
880.0
|
880.0
|
880.0
|
880.0
|
| I2
|
1.100
|
0.700
|
0.800
|
0.000
|
| r2
|
-
|
2.700
|
1.000
|
1.000
|

Parameters
|
All
Portions (FM)
|
All
Portions (AFM)
|
| A1
(%)
|
100
|
100
|
| fc1
(Hz)
|
440.0
|
440.0
|
| fm1
(Hz)
|
440.0
|
440.0
|
| I1
|
1.700
|
1.700
|
| r1
|
-
|
0.680
|
| A2
(%)
|
8
|
8
|
| fc2
(Hz)
|
220.0
|
220.0
|
| fm2
(Hz)
|
0.0
|
0.0
|
| I2
|
0.000
|
0.000
|
| r2
|
-
|
1.000
|
Parameters
|
All
Portions (FM)
|
All
Portions (AFM)
|
| A1
(%)
|
100
|
100
|
| fc1
(Hz)
|
440.0
|
440.0
|
| fm1
(Hz)
|
440.0
|
440.0
|
| I1
|
1.050
|
1.050
|
| r1
|
-
|
2.000
|
| A2
(%)
|
30
|
30
|
| fc2
(Hz)
|
2200.0
|
2200.0
|
| fm2
(Hz)
|
0.0
|
0.0
|
| I2
|
0.000
|
0.000
|
| r2
|
-
|
1.000
|
Parameters
|
Attack
(FM)
|
Attack
(AFM)
|
Attack-to-Sustain
(FM)
|
Attack-to-Sustain
(AFM)
|
Sustain
(AFM)
|
| A1
(%)
|
100
|
100
|
100
|
100
|
100
|
| fc1
(Hz)
|
440.0
|
440.0
|
440.0
|
440.0
|
440.0
|
| fm1
(Hz)
|
440.0
|
440.0
|
440.0
|
440.0
|
440.0
|
| I1
|
3.800
|
3.800
|
3.800
|
3.800
|
1.100
|
| r1
|
-
|
0.885
|
-
|
0.885
|
1.000
|
| A2
(%)
|
-75
|
-75
|
-60
|
-60
|
-25
|
| fc2
(Hz)
|
880.0
|
880.0
|
880.0
|
880.0
|
880.0
|
| fm2
(Hz)
|
880.0
|
880.0
|
880.0
|
880.0
|
880.0
|
| I2
|
1.100
|
1.100
|
1.300
|
1.300
|
0.000
|
| r2
|
-
|
1.000
|
-
|
1.000
|
1.000
|
Parameters
|
All
Portions
(AFM)
|
| A1
(%)
|
100
|
| fc1
(Hz)
|
110.0
|
| fm1
(Hz)
|
110.0
|
| I1
|
4.200
|
| r1
|
1.100
|
| A2
(%)
|
100
|
| fc2
(Hz)
|
110.0
|
| fm2
(Hz)
|
110.0
|
| I2
|
1.400
|
| r2
|
1.000
|
Parameters
|
FM
|
AFM
|
| A1
(%)
|
100
|
100
|
| fc1
(Hz)
|
1320.0
|
1320.0
|
| fm1
(Hz)
|
440.0
|
440.0
|
| I1
|
0.750
|
0.750
|
| r1
|
-
|
1.050
|
| A2
(%)
|
15
|
15
|
| fc2
(Hz)
|
2640.0
|
2640.0
|
| fm2
(Hz)
|
440.0
|
440.0
|
| I2
|
1.040
|
1.040
|
| r2
|
-
|
0.940
|
