6.1 Analysis of Real Musical Sounds
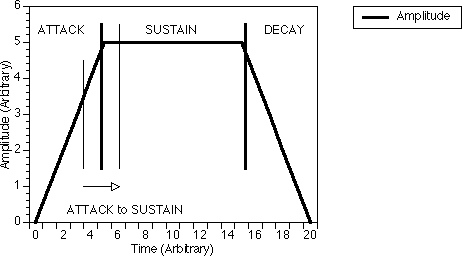
In practice, the harmonic spectrum of a real musical note such as a piano or a trumpet note does not remain constant but varies during the note. To render the real-time generation of such a musical note more feasible, we separate the duration of a musical sound into three different parts and call the first, second and third parts the "attack", the "sustain" and the "decay" respectively. The "attack" portion of the part of the waveform is the waveform produced as the amplitude of the note rises from zero to a constant value as illustrated in figure 6.1. The "sustain" portion of the waveform is the part of the waveform when its amplitude remains approximately constant as shown in figure 6.1. The "decay" portion is the part of the waveform where the amplitude decays to zero. We have also defined another portion of the waveform between the "attack" and the "sustain" as the "attack to sustain" portion. This "attack to sustain" portion is the part where the waveform makes a transition from the "attack" portion to the "sustain" portion. This is a necessary step to ensure a smoother transition as a sudden change of synthesis parameters from "attack" to "sustain" would affect the characteristic of the sound generated.
Before we can generate the spectrum of a musical instrument, we have to know what the spectrum of the real instrument is like. We therefore have to analyze the sound of the real instrument. For this purpose, we have taken the samples of musical instruments stored inside the Yamaha SY77 synthesizer (photo 6.1) memory banks. The samples in the various banks of the synthesizer are sampled from real musical instruments. This is the only commercially available synthesizer that has both the FM synthesis method and the sample playback method. The DSP (digital signal processor) of the SY77 can calculate up to 6 FM operators in real-time. It is also able to process the generated waveforms and the sampled waveforms by introducing sound effects like echo and reverberation.
The raw samples were played back at the original sampling rate and all the waveforms were divided into four portions : the "attack", the "attack to sustain", the "sustain" and the "decay". The first three portions of the waveform, i.e. the "attack", the "attack to sustain" and the "sustain", were then sampled by an ONO SOKKI [33] dual channel FFT (Fast Fourier Transform) analyzer so that their Fourier spectra could be obtained. This was done by allowing the FFT analyzer to sample only the desired portion (i.e. "attack", "attack to sustain" or "sustain") from the whole waveform that represents a note of a musical instrument. The amplitudes of all the frequency components for all portions were then noted down so that they could be used as a guide for the generation of the synthesized waveforms. They could then be compared with the synthesized waveforms that would be generated later with the AFM and DFM sound synthesis algorithms discussed earlier. The fourth portion of the waveform, i.e. the "decay" would be generated as part of the "sustain" portion of the waveform but with a decaying amplitude since the spectra of musical instruments are similar to that of the "sustain" spectra. The theory of FFT is also explained in section 6.2 of this chapter.
The ONO SOKKI Dual Channel FFT Spectrum Analyzer has a built-in 3.5 inch micro-floppy disk drive which is very useful in storing all raw and analyzed signals onto a floppy disk so that they can be recalled anytime. The two channels of the analyzer were used together most of the time so that the real and generated signals could be compared easily.
The FFT analyzer can cover a range from DC (0 Hz) to 100 kHz (or 40 kHz). The upper limit depends on the resolution of the sampled waveform, i.e. the sampling rate. The screen resolutions available are 512, 1024, 2048 and 4096 points. With 4096 points, the upper frequency displayed can reach 100 kHz. The analog to digital converter of this FFT analyzer has a 12-bit resolution. There is also a choice of several types of windowing techniques : Hanning, Triangular, Rectangular and Exponential windows. The Hanning window is used in all our experiments because of the advantages discussed in section 6.3 of this chapter. The cursor control of the analyzer is useful for determining the amplitude of the individual frequency components in a spectrum. A picture of the analyzer is shown in photo 6.2.

Photo 6.1 : The Yamaha SY77 Music Synthesizer
As the spectral analysis of the waveforms are obtained using the Fast Fourier Transform (FFT) algorithm, we briefly review the theory of the FFT [34].
The Fourier Transform of a time-varying signal x(t) is given by

f is frequency
x(t) is a function of time
[chi](f) is a function of frequency
In general, [chi](f) is complex :
Consider the discrete Fourier transform,
![]() (6.2.1)
(6.2.1)
This is simply a set of N simultaneous equations with N unknowns.
Let us consider the case where N = 4 and let
![]() (6.2.2)
(6.2.2)
Equation 6.2.1 will become
![]()
The discrete Fourier components for n = 0 to 3 are
 (6.2.3)
or in matrix notation :
 (6.2.4)
From the above, we can see that we need to perform 16 multiplications and 4 x 3 additions. In general, we need N2 multiplications and N(N - 1) additions. Since W, and possibly x0(k) are complex, these multiplications and additions are complex.
The FFT algorithm enables the numbers of multiplications and additions to be drastically reduced.
To obtain the FFT algorithm, equation 6.2.4 is first rewritten as follows,
 (6.2.5)
This simplification is obtained by noting that Wnk = Wnk
mod(N), where nk mod(N) is the remainder upon division of
nk by N, since
![]() .
.
For example, let us consider W6,
we have Wnk = W6 = e(-i2[pi]/4)6 = e-i3[pi] = e-i[pi]
= e(-i2[pi]/4)2 = W2 = Wnk mod(N)
We therefore have
![]() (6.2.6)
(6.2.6)
This implies that W6 = W2, W4 = W0 and W9 = W1.
The next step is to factorize the square matrix in equation 6.2.5 using equations 6.2.1 and 6.2.2,
![]() (6.2.7)
(6.2.7)
For our case of N = 4 = 2[gamma], we have [gamma] = 2. Therefore, we can represent k and n as 2-bit binary numbers,
![]()
We can also write k, n as
![]() (6.2.8)
(6.2.8)
where k1, k0, n1, n0 can take either 0 or 1.
Using equation 6.2.8, equation 6.2.7 can be written as
![]() (6.2.9)
(6.2.9)
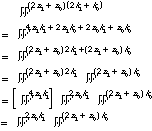
Let us now consider the W term. Since Wa+b = WaWb.
We have
 (6.2.10)
We note that
![]()
Equation 6.2.9 can therefore be written
![]() (6.2.11)
(6.2.11)
Equation 6.2.11 is the foundation of the FFT algorithm. Let us consider the two summations separately.
First, we consider the summation inside the square brackets,
![]() (6.2.12)
(6.2.12)
Expanding equation 6.2.12 for all combinations of n0 and k0 ,
 (6.2.13)
or in matrix notation,
 (6.2.14)
We now write the outer summation of 6.2.1 as
![]() (6.2.15)
(6.2.15)
and expanding the results in matrix form, we obtain
 (6.2.16)
From equations 6.2.11 and 6.2.15, we obtain
![]()
The bits in the expression for X(n1,n0) and x1(n0,n1) are reversed. This is called scrambling in the FFT algorithm. From equations 6.2.14 and 6.2.16, we may write
 (6.2.17)
After factorization, we therefore have
 (6.2.18)
We define
![]() as follows
as follows
 (6.2.19)
Let us now examine the number of multiplications. From equation 6.2.14, we have
 (6.2.20)
x1(0) is computed by one complex multiplication and one complex addition as follows
![]() (6.2.21)
(6.2.21)
x1(1) is also computed by one complex multiplication and one complex addition.
x1(2) requires only one complex addition since W0 = - W2,
(W = e-i2[pi]/N, N = 4 in this case).
Therefore
![]() (6.2.22)
(6.2.22)
where W0 has already been computed when determining x1(0).
Similarly, x1(3) requires only one complex addition,
![]() (6.2.23)
(6.2.23)
Similarly, for equation 6.2.18, we have
 (6.2.24)
where
![]() (6.2.25)
(6.2.25)
(one complex multiplication and addition)
x2(1) is computed by one addition since W0 = -W2.
x2(2) is computed by one complex multiplication and addition.
x2(3) is computed by one addition since W1 = - W3.
So
![]() is computed with a total of 4 complex multiplications and 8 complex additions,
whereas X(n) needs 16 complex multiplications and 12 complex additions.
Therefore, the FFT algorithm considerably simplifies the computation of the
DFT.
is computed with a total of 4 complex multiplications and 8 complex additions,
whereas X(n) needs 16 complex multiplications and 12 complex additions.
Therefore, the FFT algorithm considerably simplifies the computation of the
DFT.
In general, for N = 2[gamma], the FFT algorithm factorizes the N x N matrix into [gamma] matrices (each N x N) such that the factorized matrices are able to reduce the number of complex multiplications and additions. For example, we note that for N = 4, the FFT algorithm requires N[gamma]/2 = 4 complex multiplications and N[gamma] = 8 complex additions. The direct DFT method requires N2 complex multiplications and N(N-1) complex additions. We have a comparison of multiplications by DFT and the FFT in figure 6.2.1. We can see from the figure that the number of calculations for the direct calculation grows very quickly as the number of sample points increases. It is thus very clear that FFT is much more efficient, particularly for a large number of sample points.
However, since the FFT algorithm has scrambled the matrix, we need to
unscramble
![]() to obtain X(n).
to obtain X(n).
We rewrite
![]() by replacing n with its binary equivalent,
by replacing n with its binary equivalent,
 (6.2.26)
We need to flip or bit reverse the binary bits,
 (6.2.27)

When a waveform is sampled for digital signal analysis, in practice it is often only possible to sample a time-limited finite portion of the entire signal. The digitized signal would therefore appear to have started from zero at the beginning and have jumped abruptly to the amplitude of the first sample. Likewise, just before the end of the window, the amplitude would have jumped abruptly from the last sample to zero. The abrupt starting and ending of the sampled signal, when Fourier analyzed, would result in a lot of sidebands in the resulting spectrum, i.e. many other frequency components on both sides of the actual frequency component. The additional sidebands give a spectrum which is different from that of the continuous signal. To rectify this problem, windowing [35] is required.
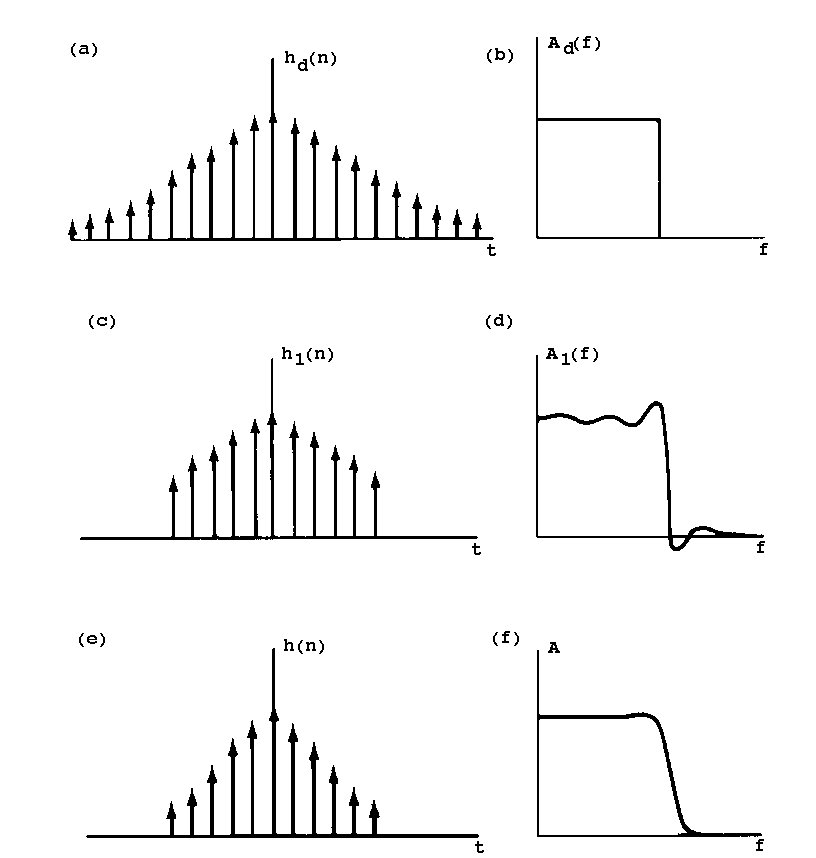
Consider an infinite series hd(n), representing a sampled
signal in figure 6.3.1 (a) which converges uniformly at +
* and -
* (this
is actually a Gaussian function). After it has been subjected to a Fourier
transform, the amplitude response Ad(f) in figure 6.3.1 (b)
is obtained.
Now, if we terminate the series abruptly without modifying any of the coefficients, i.e. the amplitudes, h1(n) will fail to converge uniformly at all points resulting in oscillations and poor convergence of the corresponding Fourier transform amplitude response A1(f). This results in the presence of the additional spectral sidebands mentioned earlier.
The process of terminating the series after a finite number of terms can be thought of as multiplying the infinite-length sampled function by a finite-width window function. This means that the window function determines how much of the original sampled function that we can "see", so the term "window" is quite descriptive.
When a series is abruptly terminated at the start and end of the window, the window is said to be rectangular.
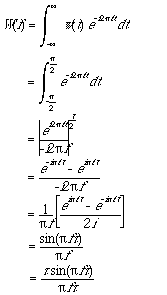
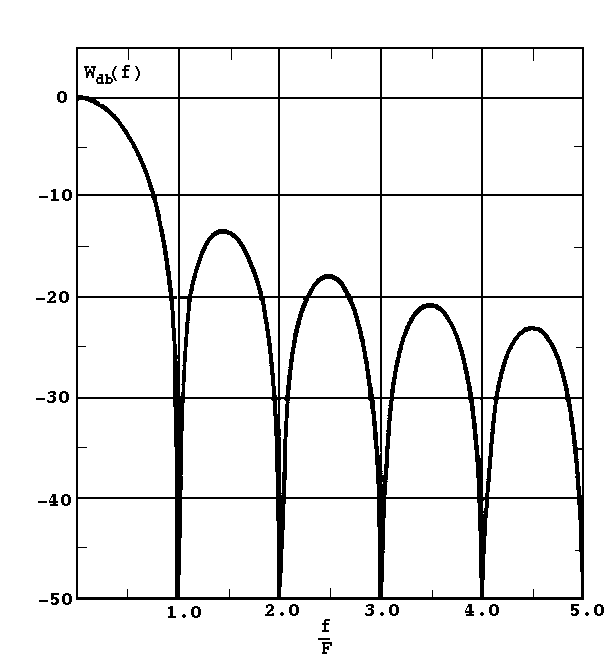
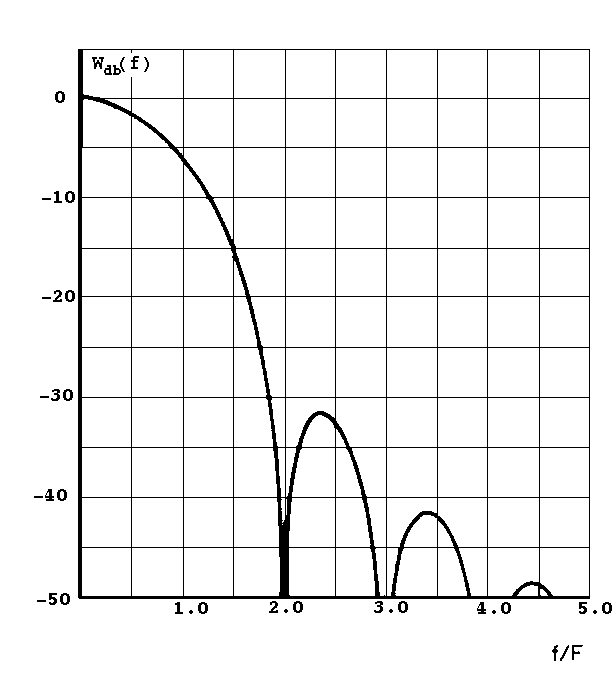
In general, the spectrum of a window function consists of a main lobe representing the middle of the spectrum and various side lobes located on either side of the main lobe. It is desired that the window function satisfies the following criteria :
(a) the main lobe should be as narrow as possible
(b) the maximum side lobe should be as small as possible relative to the main
lobe.
To study the amplitude response of a window function, we define Wdb(f), which is W(f) in terms of the decibel scale :
![]()
![]()
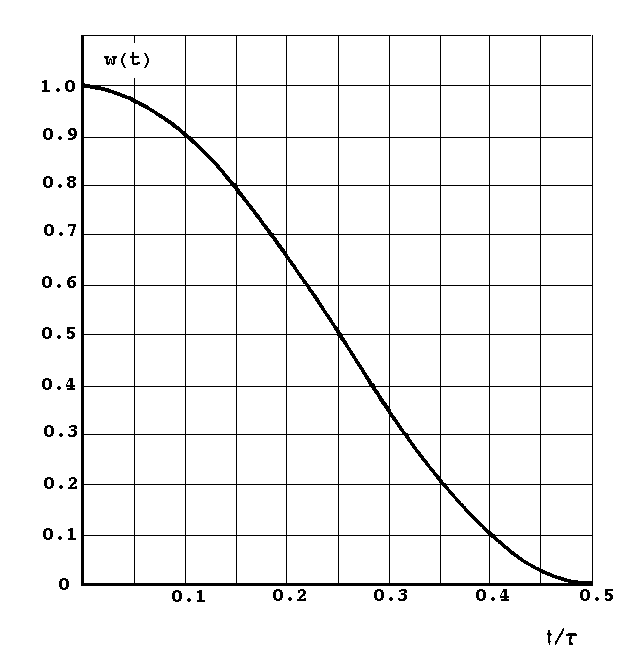
We now consider the Hanning window function, or the cosine squared window function :
![]()
Comparing the amplitude responses of the rectangular window and the Hanning window, the Hanning window has a fewer number of side lobes and they are smaller in amplitudes relative to the main lobe. After a Fourier analysis, the correct frequency components of a sampled signal will be more like those of a continuous signal using the Hanning window function. The Hanning window function was thus chosen for the analysis of our signals.
The FFT analyzer that we use applies the Hanning window to the sampled signal in the time domain, i.e. before the Fourier transform. It does this by multiplying the digitized signal from the digital to analog converter with the Hanning window function. The modified sampled is then sent to the hardware FFT module within the analyzer.

6.4 Determination of AFM and DFM Parameters
We have used the spectrum generation programs written earlier for the investigation of the spectral characteristics of AFM and DFM in Chapters 4 and 5 to determine the parameters for both the AFM and DFM synthesis algorithms which are required to synthesize waveforms which are similar to real musical sounds. The programs were written to draw the spectral lines in colour on a graphics computer screen. These programs can separate the polarity (phase) of the harmonics with two different colours on the screen of the computer. This is useful when two or more of the synthesis operators are required to interact with each other to produce the desired spectrum.
The listings of these C programs stated earlier in Chapters 4 and 5, are given in appendices 1, 2, and 3. Appendix 1 is the listing of subroutines for calculating the Bessel functions, plotting spectrum lines on the TEKTRONIX 4014 computer graphics screen and a C program that calculates the Bessel function and stores the values in a file for reference by other programs. The C programs were run on the Silicon Graphics workstation (photo 6.3) and the results were plotted on the MS-DOS Personal Computer (photo 6.4) emulating the TEKTRONIX 4014 graphics terminal. Appendices 2 and 3 are the listings for the AFM and DFM spectra generating programs respectively which are the realization of equations 4.11 (AFM) and 5.6 (DFM).
The Silicon Graphics personal workstation computer (photo 6.3) has its own graphics terminal (which is not TEKTRONIX) and a powerful RISC (Reduced Instruction Set Computer) processor. We have plotted the spectrum in colour on the MS-DOS Personal Computer emulating the TEKTRONIX 4014 graphics terminal to distinguish the phases of the harmonics. The MS-DOS Personal Computer is connected to the Silicon Graphics workstation through NUSNET (National University of Singapore NETwork), a campus wide network that connects many computers together. This allows the MS-DOS Personal Computer to communicate with the Silicon Graphics workstation at very high speed.
In the case of AFM, the carrier & modulator frequencies, the modulation index and the number of harmonics (n) to generate, are chosen based on the result of the particular waveform analyzed. If the analyzed sampled waveform has many harmonics, then the number of harmonics (n) to generate will have to be large so that all the harmonics will be covered. For example, if the spectrum of an analyzed waveform has 10 harmonics, then the number of harmonics (n) to generated will have to be set to e.g. 20, so that we can see if any unwanted higher harmonics are generated. If these unwanted higher harmonics are small compared to the necessary harmonics, then they can be ignored. Another set of synthesis parameters must be used if the unwanted higher harmonics are large.
The ratio r is made to run from some minimum value to some maximum value based on the shape of the spectrum envelope of the analyzed waveform. If more power is to be shifted to the left of the fundamental frequency, then the ratio r will have to be very much smaller than 1.0 (e.g. 0.4). If only a slight shift in power to the left of the fundamental frequency is required, then the ratio r can be set nearer to the value 1.0 (e.g. 0.8). The same applies to the shifting of power to the right of the fundamental frequency. The spectrum generated is then plotted on the TEKTRONIX graphics screen in real-time, i.e. plotted on the computer screen immediately after calculation. The actual r is chosen by visual inspection of the generated spectrum which most closely represents that of the sampled one.
Therefore, the steps for AFM synthesis are as follows :
1.) Determine the number of harmonics (n) to generate. This should be at least two times as many as the number of significant harmonics in the spectrum of the real instrument.
2.) Determine the carrier and modulator frequencies so that the spectrum generated will have components with the same frequencies as that of the spectrum of the real instrument.
3.) With the ratio r set to 1.0 (i.e. AFM becomes FM), set the value of the
modulation index I and inspect the resulting spectrum visually until a spectrum most closely resembling that of the desired spectrum is obtained.
4.) Inspect the spectrum and determine if the value of the ratio r to use should be smaller than 1.0 or greater than 1.0 by looking at both the frequency components to the left and to the right of the carrier frequency.
5.) If the value of r to be used is less than 1.0, then decrease r from 1.0 until we get a spectrum that most closely represents the desired spectrum; or if the value of r to be used is more than 1.0, then increase r from 1.0 until we get a spectrum that most closely represents the desired spectrum
For DFM, the two modulator frequencies, modulator indices and the number of harmonics (n), are also chosen depending on the waveform analyzed. The frequency ratios to use are determined by the DFM rules so that the generated harmonics will be as close as possible to those of the real musical instruments. The modulator indices are then made to run from some minimum value to some maximum value with the calculated spectrum plotted on the graphics screen in real-time. The values of these modulator indices are chosen by visual inspection of the generated spectrum which most closely represents that of the sampled one.
The steps for DFM synthesis are as follows :
1.) Determine the number of harmonics (n) to generate. This should be at least two times as many as the number of significant harmonics in the spectrum of the real instrument.
2.) Determine the carrier and modulator frequencies so that the spectrum generated will have components with the same frequencies as that of the spectrum of the real instrument using the DFM empirical rules.
3.) Set the index of modulator 1 to a value 0.5, for example, and run the index of modulator 2 from 0.5 to a higher value until the generated spectrum most closely represents the spectrum of the real instrument. If the required spectrum cannot be generated and if the unwanted higher harmonics become too large, then change the index of modulator 1 to another value and continue until the generated spectrum most closely represents that of the desired spectrum.
4.) If the desired spectrum still cannot be obtained, then add another DFM operator (operator B) and search for the values of index of modulator B1 and index of modulator B2 until the sum of the spectra from both DFM operators most closely represents that of the desired spectrum.
To more clearly explain step 4, where two DFM operators, operator A and operator B are used, consider the following simple example :
Harmonics of real instrument :
amplitude of instrument harmonic 1 = 1.0
amplitude of instrument harmonic 2 = 0.6
amplitude of instrument harmonic 3 = 0.3
amplitude of instrument harmonic 4 = 0.4
amplitude of instrument harmonic 5 = 0.2
If DFM operator A can generate the following harmonics :
amplitude of operator A harmonic 1 = 1.0
amplitude of operator A harmonic 2 = 0.4
amplitude of operator A harmonic 3 = 0.2
amplitude of operator A harmonic 4 = 0.5
amplitude of operator A harmonic 5 = 0.1
Then DFM operator B will have to be able to generate the amplitude differences :
amplitude of operator B harmonic 1 = instrument harmonic 1 - operator A harmonic 1 = 0.0
amplitude of operator B harmonic 2 = instrument harmonic 2 - operator A harmonic 2 = 0.2
amplitude of operator B harmonic 3 = instrument harmonic 3 - operator A harmonic 3 = 0.1
amplitude of operator B harmonic 4 = instrument harmonic 4 - operator A harmonic 4 = - 0.1
amplitude of operator B harmonic 5 = instrument harmonic 5 - operator A harmonic 5 = 0.1
For example, if operator A can generate harmonic 2 with amplitude 0.4, which is 0.2 less than the desired harmonic, operator B will have to be able to generate harmonic 2 which is the difference of the desired harmonic 2 and the operator A harmonic 2, i.e. 0.6 - 0.4 = 0.2. Therefore, operator B will have to have harmonic 2 of amplitude 0.2.