5.1 A New Modification of Frequency Modulation Synthesis
We now propose a new modification of FM synthesis.
Consider the simple FM equation in equation 2.4
![]()
![]() (5.1)
(5.1)
where
I1 and I2 are the modulation indices of the first and second modulators respectively,
and
[omega]1 and [omega]2 are the angular frequencies of the first and second modulators respectively.
We call the above modification of FM double frequency modulation (DFM).
In the next section, we will obtain the spectral representation of equation 5.1.
Let us rewrite equation 5.1 by making use of the following trigonometric identity,
![]() (5.2)
(5.2)
We therefore obtain,
![]() (5.3)
(5.3)
Let us assume that xc(t) is normalized i.e. A = 1. Then, by making use of equation 2.7, we will obtain
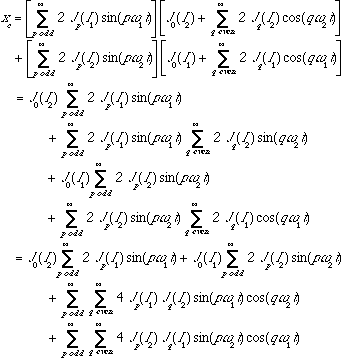 (5.4)Using
the trigonometric relation as in equation 2.10, we will get,
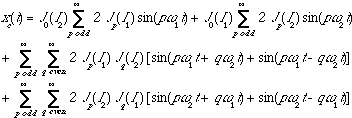 (5.5)
(5.5)
The spectral equation for xc(t) is therefore
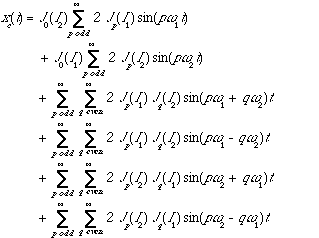 (5.6)
(5.6)
In the above equation, the indices, odd p and even q, run from -[infinity] to +[infinity] giving rise to frequency lines that lie in the negative region of the frequency axis, as in the case of FM. We therefore have to reflect these lines around the 0 Hz axis with their phases inverted and the resulting amplitudes are added to the corresponding lines in the positive region which the reflected lines overlap. These lines are called reflected side frequencies and they have already been discussed earlier in section 2.1.
5.3 Spectrum of Double Frequency Modulation
We have also written a computer program in C to generate the DFM harmonics represented by equation 5.6 so that the spectral behaviour of DFM can be studied. Figure 5.1 shows the algorithm in Pascal-like pseudo code of the spectrum generating C program. The full listing of the C program, DFMSPRT2.C, is in appendix 3.
We have broken down equation 5.6 into six terms :
Term 1 :
![]() for freqA and ampA
for freqA and ampA
Term 2 :
![]() for freqB and ampB
for freqB and ampB
Term 3 :
![]() for freqC and ampC
for freqC and ampC
Term 4 :
![]() for freqD and ampD
for freqD and ampD
Term 5 :
![]() for freqE and ampE
for freqE and ampE
Term 6:
![]() for freqF and ampF
for freqF and ampF
Before the start of the C program, all the variables oddN, evenN, freqA, ampA, freqB, ampB, freqC, ampC, freqD, ampD, freqE, ampE, freqF and ampF are declared. The variables freqA to freqF and ampA to ampF are used to store the calculated frequency components and amplitudes of the terms 1 to 6 respectively in equation 5.6 temporarily. The variables oddN and evenN are running indices that represent odd p and even q in equation 5.6.
The constants minOddN, maxOddN, minEvenN and
maxEvenN represent -p, +p, -q and +q
respectively. In equation 5.6, the indices p and q actually
run from -
* to +
*. However, in the computer, we cannot
have -
* or +
*. So, minOddN, maxOddN,
minEvenN and maxEvenN are some numbers that are large enough so
that the calculated DFM spectrum is accurate. As we know that value of the
Bessel function will be diminish with increasing order, we have chosen these
indices to be about 12. The reason for choosing this value has already been
discussed in chapter 4.
An array, i.e. reserved memory in the computer, is declared to store the calculated amplitudes for the respective frequency components. Its size is determined by a constant MaxFreqToPlot, which is the highest frequency component we want plotted on the graphics screen of the computer.
The Bessel function generated by another program and stored in a file is also read into the computer memory as a look up table so that the calculation of the amplitudes of the various frequency components can be done very quickly.
START
Run the index oddN from minOddN to maxOddN
{
freqA = calculated frequency of term 1
ampA = calculated amplitude of term 1
freqB = calculated frequency of term 2
ampB = calculated amplitude of term 2
If freqA is negative then invert the sign of freqA and ampA
If freqB is negative then invert the sign of freqB and ampB
Add ampA into array(freqA)
Add ampB into array(freqB)
Run the index evenN from minEvenN to maxEvenN
{
freqC = calculated frequency of term 3
ampC = calculated amplitude of term 3
freqD = calculated frequency of term 4
ampD = calculated amplitude of term 4
freqE = calculated frequency of term 5
ampE = calculated amplitude of term 5
freqF = calculated frequency of term 6
ampF = calculated amplitude of term 6
If freqC is negative then invert the sign of freqC and ampC
If freqD is negative then invert the sign of freqD and ampD
If freqE is negative then invert the sign of freqE and ampE
If freqF is negative then invert the sign of freqF and ampF
Add ampC into array(freqC)
Add ampD into array(freqD)
Add ampE into array(freqE)
Add ampF into array(freqF)
}
}
Plot the values in array(0) to array(MaxFreqToPlot) onto the graphics screen
END
From here, another index evenN is made to run from minEvenN to maxEvenN creating another computational loop nested within the first loop (that of oddN). In this second loop, freqC, ampC, freqD, ampD, freqE, ampE, freqF and ampF are calculated from terms 3 to 6 of equation 5.6. A check on freqC, freqD, freqE and freqF is done to see if any of them is a negative value. The negative frequencies are then changed into positive frequencies with their amplitudes inverted in sign. This is done to reflect negative frequency components into the positive region about the 0 Hz axis with sign inversion.
After this, ampC, ampD, ampE and ampF are added into the arrays array(freqC), array(freqD), array(freqE) and array(freqF) for the same reasons as for freqA and freqB.
When the indices oddN and evenN have reached maxOddN and maxEvenN respectively, the program exits from the loops and will start plotting the calculated frequency components as vertical lines on the TEKTRONIX 4014 computer graphics screen. The length of each line represents the calculated amplitude of that frequency component. Negative amplitudes are plotted as vertical lines in the positive region of the amplitude axis but with a different colour. The amplitudes are also saved in a file for future reference.
By studying the output of the program, we have found out that the frequencies of the DFM harmonics depend on the relative values of f1 and f2. Let us consider the case when f2 is greater than f1, and f2/f1 = N2/N1, where N1 and N2 are non-zero integers not having a common factor. The following empirical rules for the frequencies generated apply for the DFM harmonics :
a.) N1 odd, N2 odd
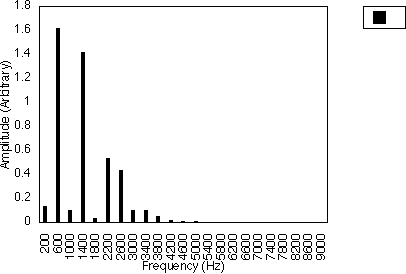
We first consider the case when N1 is an odd number. If N2 is also an odd number, then the frequency difference between harmonics will be 2f1/N1 i.e. the harmonic frequencies are given by :
f = f1 +/- n 2f1/N1 , n = 0,1,2,3,...
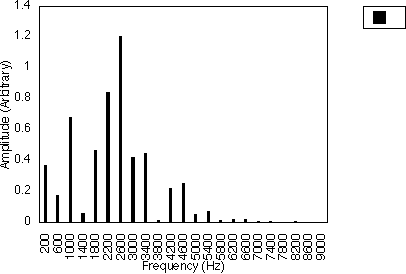
Figure 5.2 illustrates this for f1 = 200 Hz and f2 = 600 Hz. In this case, N1 = 1 and N2 = 3 and the spacing between successive harmonics is 2 x 200/1 Hz i.e. 400 Hz. Figure 5.3 shows the case when f1 = 200 Hz and f2 = 1000 Hz, i.e. N1 = 1 and N2 = 5. The harmonic spacing is still 400 Hz, but the relative amplitudes of the harmonics are different. So, for these two cases, the harmonics generated are 200 Hz, 600 Hz, 1000 Hz, 1400 Hz ....
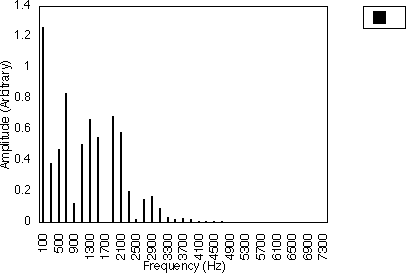
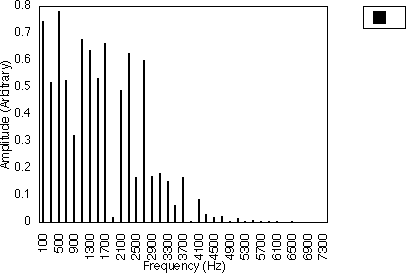
Figures 5.4 and 5.5 also illustrate this for the case of N1 = 3. In figure 5.4, f1 = 300 Hz and f2 = 500 Hz, i.e. N2 = 5; in figure 5.5, f1 = 300 Hz and f2 = 700 Hz, i.e. N2 = 7. These two cases have the same harmonic spacing of (2 x 300)/3 Hz i.e. 200 Hz, but the relative amplitudes of the harmonics are different. For these two cases, the harmonics generated are 100 Hz, 300 Hz, 500 Hz, 700 Hz ....
For the case when N1 is odd and N2 is even, the frequency difference between harmonics will be f1 / N1 i.e. the harmonic frequencies are given by :
f = f1 +/- n f1 / N1 n = 0,1,2,3,...
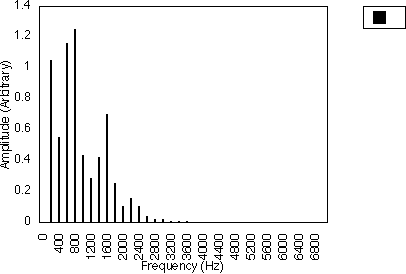
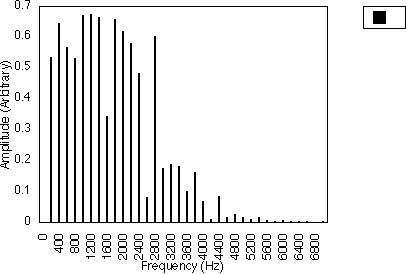
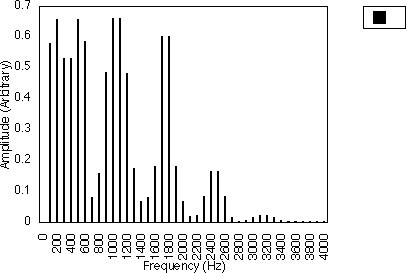
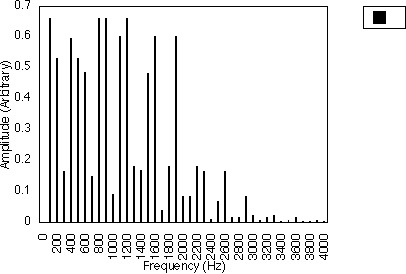
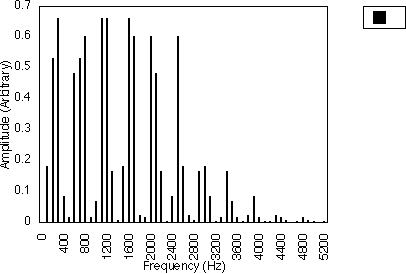
Figures 5.6 and 5.7 give examples for f1 = 200 Hz and N1 = 1, for N2 = 2 and 4 respectively i.e. f2 = 400 and 800 Hz. The spacing between harmonics is 200/1 i.e. 200 Hz. The relative amplitudes of the harmonics vary with the actual value of N2 and hence with f2. The generated harmonics for both cases are 0 Hz, 200 Hz, 400 Hz, 600 Hz ....
Figures 5.8 and 5.9 give examples for f1 =300 Hz and N1 = 3, for N2 = 4 and 8 respectively i.e. f2 = 400 and 800 Hz. The spacing between harmonics is 300/3 i.e. 100 Hz. Again, the relative amplitudes of the harmonics vary with the actual value of N2 and hence with f2. The generated harmonics for both cases are 0 Hz, 100 Hz, 200 Hz, 300 Hz ....
c.) N1 even, N2 odd
For even values of N1, N2 will always be an odd number. In this case, the frequency difference between harmonics will also be f1/N1 i.e. the harmonics frequencies are also given by :
f = f1 +/- n f1 / N1 n = 0,1,2,3,...
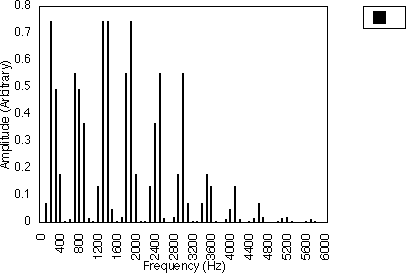
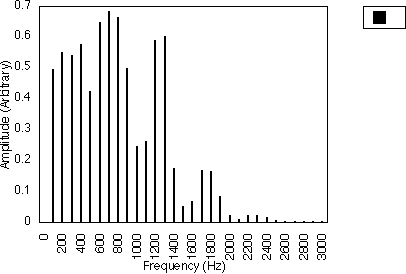
Figures 5.10, 5.11 and 5.12 give examples for f1 = 200 Hz and N1 = 2, for N2 = 3, 5 and 7 respectively i.e. f1 = 300, 500 and 700 Hz. In all three cases, the spacing between harmonics is 200 / 2 i.e. 100 Hz. However, the relative amplitudes of the harmonics varies with the value of N2 and hence f2 . It may be observed from figures 5.10, 5.11 and 5.12 that many of the harmonics are diminished in amplitude for higher values of N2. The generated harmonics for these three cases are 0 Hz, 100 Hz, 200 Hz, 300 Hz ....
d.) f1 or f2 is zero
When either one of the two frequencies is absent, e.g. f2 is zero, then equation 5.1 will contain only f1 or [omega]1 :
x(t) = A sin [ I1 sin ( [omega]1t) ]
Then harmonics generated are given by :
f = f +/- n f, n = 0,1,2,3,...
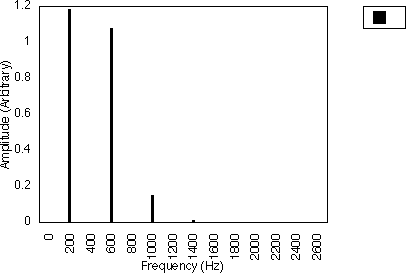
The spacing between harmonics is equal to f1. This can also be interpreted as a case of N1 = 1 and N2 even, regarding zero as an even integer. It can also be regarded as a special case of simple FM, with the carrier frequency fc equal to zero. It may be observed that some of the harmonics, while non-zero, are insignificant though not zero.
Figure 5.13 illustrates this for f1 = 200 Hz and f2 = 0 Hz. The spacing between successive harmonics is 200 Hz. However, the 400, 800, 1200 Hz etc. frequency components have very small but non-zero amplitudes that are negligible when compared to the 200 Hz and 600 Hz frequency components.
5.4 Advantages of Double Frequency Modulation
DFM thus provides an alternative method of digital sound synthesis in which, like simple FM synthesis, harmonic frequencies can be generated from two given frequencies. In FM, the harmonic spacing is the difference between the carrier frequency and the modulating frequency. In DFM, for a given value of f1, it is possible to produce harmonics with spacings of 2f1, f1 or a sub-multiple of f1, depending on the ratio of f1 and f2. The relative amplitudes of the harmonics are dependent on the actual value of the higher of the two frequencies. The special case of DFM when one frequency is zero is equivalent to the special case of FM when the carrier frequency is zero.
FM has deservedly become recognized as one of the most efficient methods of digitally generating musical sounds with rich harmonic components. However, the harmonics are limited by the fact that the FM spectrum is symmetrically arranged on either side of the carrier frequency. In order to obtain complex harmonic envelopes, it may be necessary to employ complex combinations of several FM operators. Asymmetrical FM or AFM as described in chapter 3 is able to overcome this by employing an additional parameter which modifies the simple FM equation. This results in FM spectra which are asymmetrical about the carrier frequency and hence able to simulate more complex spectral envelopes with fewer FM operators. However, the AFM method of synthesis, while practical for real-time generation, imposes a greater computational load on the digital generator compared to simple FM.
DFM synthesis offers an alternative to FM and AFM, in that sounds with more complex harmonic envelopes than simple FM may be generated, while avoiding the computational load of AFM. For example, we have found that DFM is able to control the symmetry of the spectrum around a dominant spectrum line to a certain extent, depending on both f1 and f2.
Let us illustrate this by giving an example. In figures 5.14a, 5.14b, 5.14c, 5.14d and 5.14e, we have f1 = 200 Hz, I1 = 1.3, f2 = 800 Hz and I2 runs from 1.6 to 2.4 in steps of 0.2. In these figures, as I2 increases, the power drifts from the left side of the dominant harmonic (800 Hz) to the right side.
When the ratio of f1 and f2 is great and I1 is smaller than I2, for example, when f1 = 200 Hz, f2 = 2000 Hz, I1 = 0.8 and I2 = 7.7, the spectrum of DFM has a special characteristic. In figure 5.15, we can see that there are several clusters of harmonics and each cluster has either two harmonics of the same amplitude or, one dominant harmonic with two sidebands of equal amplitudes. When I2 is smaller, we will get fewer of these clusters. We have also observed that when I2 is increased from a lower value to a higher value, more and more of these clusters will be generated at higher frequencies.
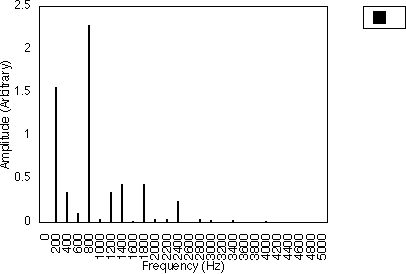
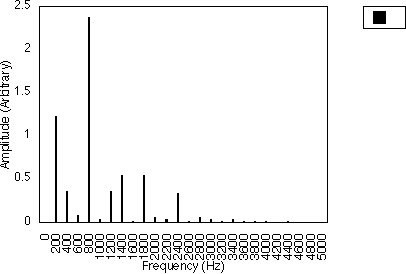
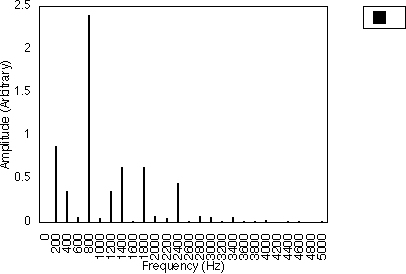
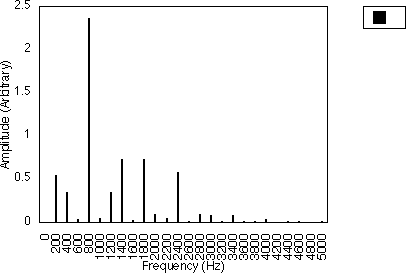
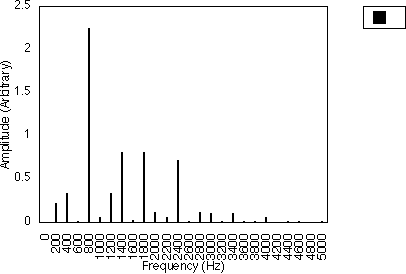
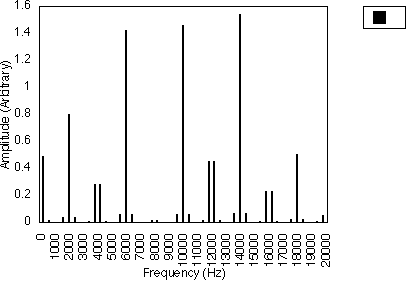
Figure 5.15 shows the spectra for f2 = 200 Hz and I2 from 0.2 to 10.2 in steps of 0.2. We have switched the modulator with frequency f1 off by letting I1 = 0. As I2 increases, we can see that more and more harmonics start to appear. The fundamental frequency starts to diminish as the first harmonic grows until when I2 is about 3.7, it becomes zero. It starts to grow again for I2 > 3.7. The first harmonic shows the same behaviour as I2 becomes even larger. The amplitude of the harmonics fluctuates about the zero amplitude as I2 is increased. The empirical rule (d) stated earlier gives us
f = 200 +/- n 200 = 0, 200, 400, 600, 800, 1000 .... n = 0,1,2,3,...
Note that 0, 400, 800, 1200 and so on are very small when compared to the other harmonics. This corresponds to the cases mentioned earlier in which some of the harmonics are so small that they can be neglected when compared to the larger harmonics.
In figure 5.16, we have an example where f2/f1 = 200/100 = N2/N1 = 2/1, i.e. N1 is odd and N2 is even. We find that the harmonics begin with 0 Hz and have a frequency difference of 100 Hz, i.e. 0, 100, 200, 300, 400, ... etc. This is in accordance with the rule (b) stated earlier. Here, we have set I1 = I2 and increased it from 0.2 to 7.0 in steps of 0.2. Since f1 = 100 Hz and f2 = 200 Hz, these two harmonics will be dominant at the beginning when I1 and I2 are small. As before, the harmonics fluctuate about zero amplitude as I1 and I2 are increased together.
The case for f2/f1 = 600/200 = N2/N1 = 3/1, i.e. N1 is odd and N2 is also odd is illustrated in figure 5.17. With the empirical rule (a) in mind, we will find harmonics occurring at
f = f1 +/- n 2f1/N1= 200 +/- n(2 x 200)/1 = 200, 600, 1000, 1400, 1800 ....
with 200 Hz and 600 Hz dominating at the beginning (when I1 and I2 are small).
In figure 5.18, we have another example of N1 odd and N2 even. With f1 = 200 Hz and f2 = 800 Hz, according to the empirical rule (b), harmonics occur at
f = f1 +/- n f1/N1= 200 +/- n(200)/1 = 0, 200, 400, 600, 800, 1000 ....
Figures 5.19, 5.20 and 5.21 give examples of N1 = 2 & N2 = 3, N1 = 2 & N2 = 5 and N1 = 2 & N2 = 7, i.e. N1 even & N2 odd. Again with the empirical rule (c) in mind, we will have
f = f1 +/- n f1/N1 = 0, 100, 200, 300, 400, 500, ...
which are the harmonics we see in the figures.
Figures 5.22, 5.23 and 5.24 are examples of the ability of DFM to control the symmetry of the spectrum around a dominant spectrum line. In figure 5.22, f1 = 200 Hz, I1 = 1.3, f2 = 800 Hz and I2 runs from 1.6 to 2.5 in steps of 0.1. In figure 5.23, f1 = 200 Hz, I1 = 1.3, f2 = 1000 Hz and I2 increases from 1.6 to 2.5 in steps of 0.1. In figure 5.24, f1 = 200 Hz, I1 = 1.0, f2 = 1200 Hz and I2 increases from 1.7 to 2.3 in steps of 0.1. In these three figures, as I2 increases, the power drifts from the right side of the dominant harmonic to the left side.


