2.1 Definition of Frequency Modulation
[14][20]
The Frequency Modulation technique is used widely in radio transmission and was not applied to sound synthesis until Chowning proposed that by setting both the carrier and modulator frequencies at audio frequencies [14], it could generate useful musical waveforms. The usefulness of the FM technique as applied by Chowning lies principally in the use of the rich FM sidebands as harmonics for the synthesized waveform.
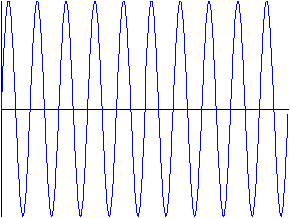
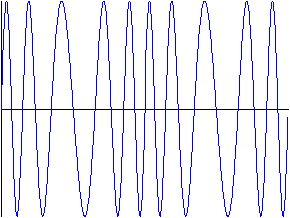
Let us consider an FM carrier waveform of frequency f0 which is frequency modulated by a sinusoidal waveform or tone as illustrated in figure 2.1.
Let the modulating waveform x(t) have a circular frequency [omega]m, amplitude Am , and let the time be t, i.e. x(t) = Am cos [omega]mt. The instantaneous frequency, f0 , of the FM wave is then defined as
![]() (2.1)
(2.1)
and xc (t), the resulting carrier wave
 (2.2)
(2.2)
Carrier Waveform
Modulator Waveform

FM Waveform
where Kf is the frequency deviation constant. Let us denote
![]() (2.3)
(2.3)
so that equation 2.2 becomes
![]() (2.4)
(2.4)
The parameter I defined in equation 2.3 is called the FM modulation index, and has two properties : (1) it is defined only for sinusoidal waveform modulation, and (2) it depends on both the amplitude and frequency of the modulating waveform. Examining equation 2.4, we can see that I is the maximum phase deviation produced by the sinusoidal waveform in question. The relative phase of xc(t) is
![]() (2.5)
(2.5)
Therefore, sinusoidal waveforms having the same amplitude to frequency ratio will have the same maximum phase deviation but different rates of modulation. From equation 2.1, the instantaneous frequency deviation depends only on the amplitude of the sinusoidal waveform and Kf, the latter being a property of the modulating circuit.
For spectral analysis, we apply Fourier analysis to express xc(t) as a sum of sinusoids, i.e. as a Fourier series. Let us rewrite equation 2.4 in the following form :
![]() (2.6)
(2.6)
We will use the following well known mathematical relationships,
 (2.7)
(2.7)
where n is positive and
 (2.8)
(2.8)
where Jn(I) are Bessel functions of the first kind.
Making use of equation 2.7, we have
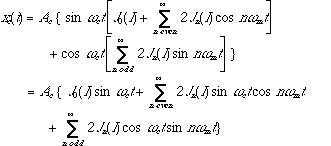 (2.9)
(2.9)
Using the following trigonometric relationships,
![]() (2.10)
(2.10)
we obtain,
 (2.11)
Using the following property of Bessel functions,
![]() where n = 1, 2, 3, . . . (2.12)
where n = 1, 2, 3, . . . (2.12)
we finally obtain the following more compact expression,
![]() (2.13)
(2.13)
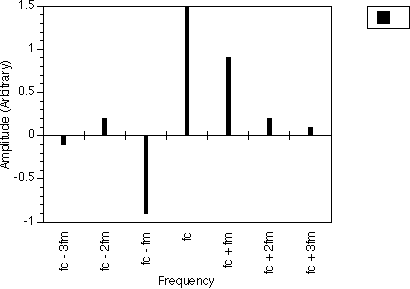
On examining equation 2.13, we can see that the FM spectrum can be considered to be made up of a carrier frequency at fc and an infinite number of sidebands at frequencies fc +/- nfm. The relative amplitude of a particular sideband at fc +/- nfm is governed by Jn(I), the Bessel function for the particular n. A typical spectrum is illustrated in figure 2.2.
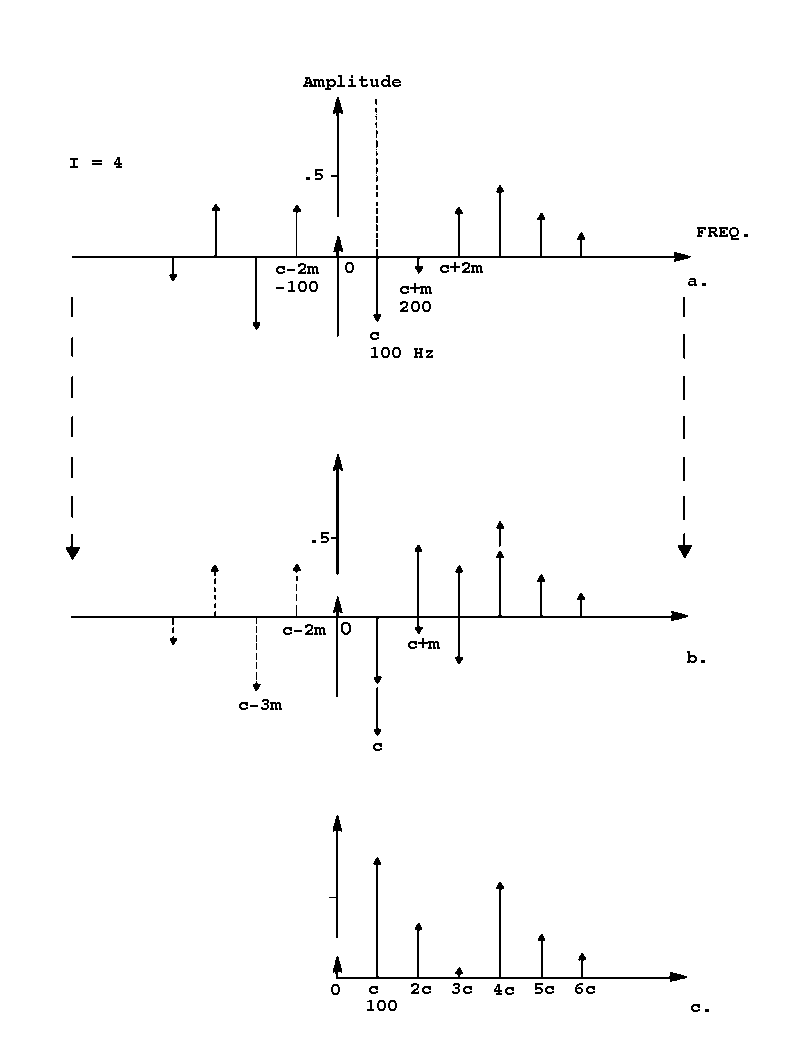
Since n in equation 2.13 runs from -[infinity] to +[infinity], there will be sideband lines that lie in the negative region of the frequency axis. Since a negative frequency oscillates in opposite phase to that of the positive frequency, these negative sideband lines are to be reflected about the 0 Hz axis with their phase inverted and added to the sidebands that appear on the positive region of the frequency axis. These are called reflected side frequencies.
To illustrate, consider both a carrier and a modulating wave of frequency 100 Hz with modulation index I of 4. In figure 2.3a, the positive and negative sidebands are in their original positions. Then in figure 2.3b, the negative sidebands have been reflected about the 0 Hz axis, inverted in phase and added to the positive sidebands in the positive side of the frequency axis. For example, the second lower sideband at -100 Hz will add to the carrier since it has a similar phase after reflection, increasing the energy at 100 Hz, while the third lower sideband at - 200 Hz will get subtracted from the first upper sideband since it has an opposite phase after reflection, decreasing the energy at 200 Hz. Figure 2.3c shows the spectrum adjusted for the reflected sidebands and with all bars plotted in the positive region since our ears cannot distinguish between positive and negative phase. This will also allow us to see the spectral envelope more easily.
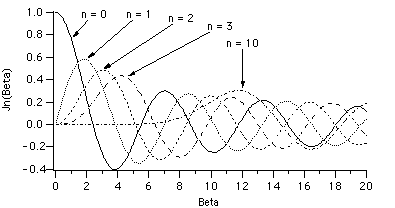
Let us now examine the behaviour of the Bessel function. In figure 2.4, several orders of the Bessel function with argument I are plotted. We see that the Bessel function varies in a cyclic fashion and its amplitude decays as I is increased for a particular order. As the order gets higher, the maximum amplitude of the Bessel function decreases rapidly. This characteristic tells us that the Bessel function converges.
2.2 Spectra of Frequency Modulation
So far, we have only looked at the generation of harmonic spectra by FM, i.e. where the spectral components are integral multiples of the fundamental frequency. The FM equation gives harmonic spectra for cases when the ratio of the carrier frequency to that of the modulator frequency is a ratio of two integers. In the demonstration of reflected side frequencies in figure 2.3, the ratio of the carrier to the modulator frequencies is 1/1.
Thus, we have, for harmonic spectra
![]() (2.14)
(2.14)
and N1 and N2 are integers.
If all the common factors are divided out of N1 and N2, the fundamental frequency of the modulated waveform is
![]() (2.15)
(2.15)
For example, if we have fc = 880 Hz and fm = 440 Hz, then according to equation 2.14, fc/fm = 2/1 where N1 = 2 and N2 = 1. From equation 2.5, the fundamental frequency f0 will be 440 Hz.
We can also determine the position of the harmonics from the following equation
![]() (2.16)
(2.16)
The k is the harmonic number and n is the order of the side frequency. Notice that k has two values for each n except when n = 0, the carrier.
For example, if we have, again, fc = 880 Hz and fm = 440 Hz, N1 = 2 and N2 = 1, we can find the positions of the side frequencies with equation 2.16. When n = 0, the N1 th harmonic, which is the second harmonic in the spectrum, is the carrier frequency and it is 880 Hz. For n = 1, i.e. first order, k will have two values, 3 and 1, i.e. two sideband frequencies, 1320 Hz and 440 Hz.
With simple ratios, i.e. N1/N2 = 2/1, 4/1, 1/2, 1/4, 3/2 etc., the following characteristics can be observed :
1.) The N1th harmonic is always the carrier frequency in the spectrum.
2.) When N2 = 1, all harmonics are present in the spectrum and the fundamental is at the modulating frequency, e.g. 1/1 and 2/1.
3.) When N2 is even, we will have only odd-numbered harmonics, e.g. 1/2, 1/4, 3/2, 3/4 and 5/2.
4.) For N2 = 3, every third harmonic is missing from the series, e.g. 1/3, 2/3, 4/3 and 5/3.
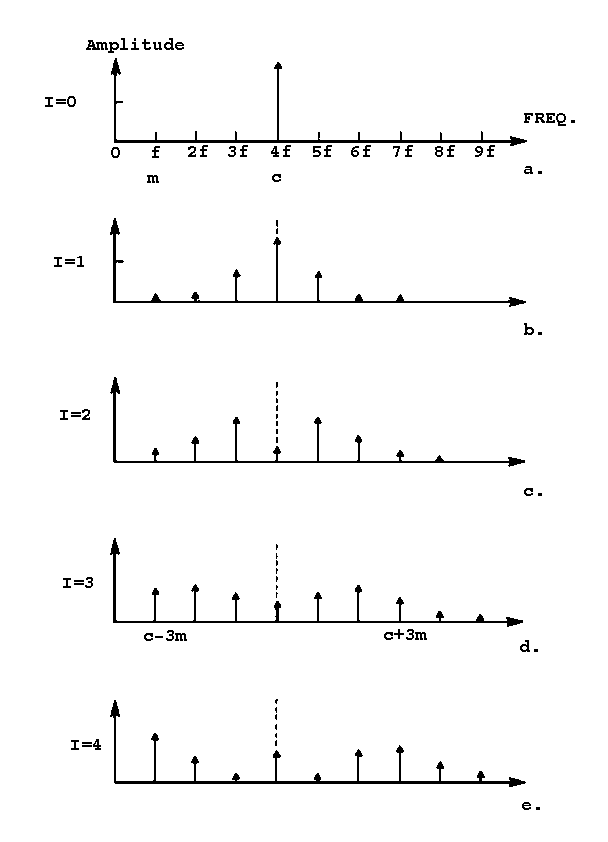
The number of harmonics that make a significant contribution to the spectrum depends on the modulation index I. When I is small and for ratios of fc/fm where N1 is not 1, the fundamental frequency may become insignificant in the spectrum. An example is shown in figure 2.6 where we have fc/fm = 4/1. It shows that increasing the modulation index has the effect of increasing the amplitudes of the harmonics and attenuating the amplitude of the fundamental frequency. The fundamental frequency becomes significant again only when I is greater than 2 in such cases.
In figure 2.6, we can also notice that the FM spectrum is symmetrical about the carrier frequency. When the modulation index I is increased, the harmonics on both sides of the carrier frequency increase similarly giving rise to a symmetrical spectrum. This is a limitation of the FM synthesis technique since we cannot make it asymmetrical.
If the ratio fc/fm is irrational, i.e. cannot be
expressed as the ratio of two integers, we will get inharmonic spectra. Some
examples are when fc/fm = 1/
![]() ,
[pi]/
,
[pi]/
![]() and 1/e. The reflected frequencies from the negative side of the frequency
axis will fall between those in the positive side forming a spectrum whose
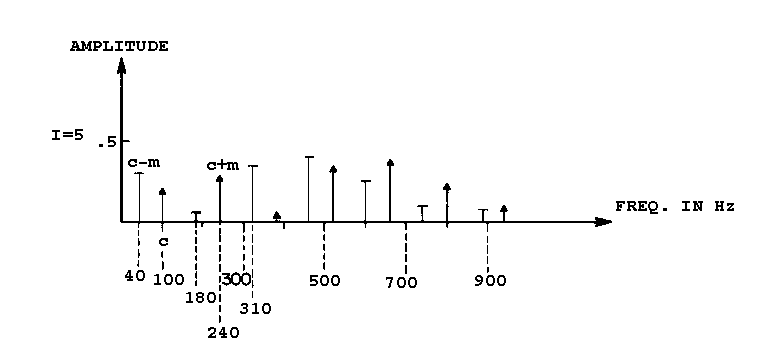
components have no relation with simple ratios. Figure 2.7 shows an example of
an inharmonic spectrum with fc / fm ~ 1/
and 1/e. The reflected frequencies from the negative side of the frequency
axis will fall between those in the positive side forming a spectrum whose
components have no relation with simple ratios. Figure 2.7 shows an example of
an inharmonic spectrum with fc / fm ~ 1/
![]() and index = 5.
and index = 5.
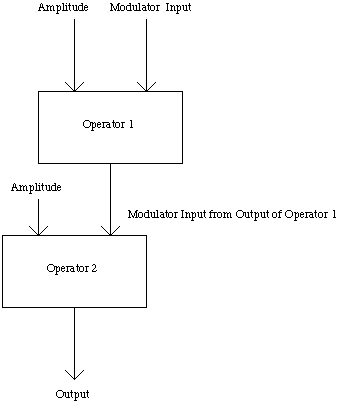
In the sound synthesis of musical instruments, one FM equation or an operator can be combined with one or more FM operators to synthesize different types of complex waveforms with complex spectra. For a single FM operator, one can synthesize a number of musical instruments with simple spectra. If one uses multiple FM operators, musical instruments with more complex spectra can be synthesized. In the use of multiple FM operators, the operators can either operate individually with their outputs added together to form a resultant waveform or they can be stacked up in a series with the output of one FM operator modulating the modulator frequency of another FM operator giving rise to a more complicated waveform. An example of stacked operators is shown in figure 2.8.
In a recent paper Holm [21], proposed the standardization of the implementation of the FM synthesis equation, i.e. equation 2.4. He pointed out that there are several incompatible versions of the FM formula which are quite often believed to be one and the same.
Because of this, many implemented FM algorithms in different parts of the world are not strictly compatible with each other. Their FM patches (i.e. the FM parameters for synthesizing a musical instrument or sound) cannot be transferred freely from one algorithm to another without any distortion. To correct this problem, changes to the FM parameters usually have to be made. This has led to much confusion and many inconsistencies with respect to the FM algorithm.
According to Holm, this ambiguity in the FM algorithm originated with the MUSIC-V FM implementation as used by Chowning [14]. The MUSIC-V FM Representation is shown in figure 2.5. In Chowning's original FM paper [14], the IF (i.e. instantaneous frequency) mentioned by Holm is called the Frequency Deviation d = I m, where I is the modulation index and m is the modulation frequency. It has been widely assumed that MUSIC-V FM patch computes a sampled version of FM equation exactly, when in actual fact it generates another function not represented by equation 2.4. Holm's paper points out that the original MUSIC-V FM patch computes the following equation :
![]() (2.17)
(2.17)
Holm also points out that the Yamaha DX7 FM synthesizer does not follow equation 2.4 strictly and that the phases of the generated spectra vary with different ratios of fc : fm making them different from the expected spectra given by equation 2.13.
However, in our present work all the synthesis programs follow their respective synthesis equations exactly without any modification. This is necessary so that an accurate prediction of the resulting spectrum is possible.
FM synthesis has undergone several developments since 1973. These include the creation of a trumpet algorithm for the FM synthesis method [22], improved methods for real-time FM synthesis [23], using a complex modulating wave instead of a sine wave to synthesize sounds of natural instruments [24], derivation of FM spectrum with a complex modulating wave [25] and organizational techniques for the carrier to modulator frequency ratios [26]. Moorer includes FM in his important survey of the digital signal processing aspects of computer music [27].

