Contents
If you use this code, please acknowledge the following papers:
- First Paper On Unlimited Sampling by A Bhandari, F Krahmer, R Raskar in Proc. of Sampling Theory and Applications Conference (SampTA), 2017
- Main Paper On Unlimited Sampling and Reconstruction by A Bhandari, F Krahmer, R Raskar in IEEE Trans. on Signal Proc., 2021
- First Hardware Paper Unlimited Sampling from Theory to Practice: Fourier-Prony Recovery and Prototype ADC by A Bhandari, F Krahmer, T Poskitt in IEEE Trans. on Sig. Proc. (IEEE TSP 2021, arXiv version: https://arxiv.org/abs/2105.05818)
clc
close all
clear all

set(0,'defaultlinelinewidth',2)
Basic Function Definitions
e = exp(1);
frac = @(x) x-floor(x);
RD = @(x,L) round(x./(2*L)).*2*L;
M = @(f,T) 2*T.*( frac(f./(2.*T) + 0.5) -0.5 );
K = @(x) sinc(x);
DO_US = @(T,L,Bg) ceil((log(L) - log(Bg))/log(T*pi*exp(1)));
LT = @(L,ts) L.*ones(numel(ts),1);
Prepare Analog and Digital Signals
t = -20:0.005:20; t = t(:);
Ts = 0.005/0.055;
Td = ceil(1/Ts);
locs = 1:Td:numel(t);
ts = t(locs);
Z = rand(numel(t),1) + 1i.*rand(numel(t),1);
F = fft(K(t)).*Z;
f = real(ifft(F));
f = f./max(abs(f));
f = f-mean(f);
Unlimited Sampling
data = f(locs);
data0 = data;
L = 1/100;
mdata = M(f,L);
mdm = M(data,L);
Reconstruction from Unlimited Samples
DO = DO_US(mean(diff(ts)),L,max(f));
rec = M(diff(mdm,DO),L);
tsDO = ts(1:end-DO);
plot(tsDO,rec,tsDO,LT(L,tsDO),tsDO,-LT(L,tsDO));
clear Kn ds res al bl
ds = diff(mdm,DO);
res = rec(:) - ds(:);
res = RD(res,L);
cntr = cell(DO);

clear S2 Kn_iter Rec_Sig al bl egN cntr
al = res;
bl = res;
egN = al;
g0 = ceil(max(abs(data)));
Bg = ceil(g0/(2*L))*2*L;
J = ceil(6*Bg/L);
for k = 1: DO-1;
cntr{k} = egN;
S2 = cumsum([0 ;(cumsum([0;egN]))]);
Kn_iter = floor((-S2(J+1) + S2(1))/(12*Bg) + 0.5)
bl = cumsum([0; bl]);
bl = RD(bl,L);
bl = bl + 2*Kn_iter*L;
egN = bl;
end
close all
Rec_Sig = cumsum([0; bl])+mdm(:);
offset = (data(locs(1)) - Rec_Sig(1))/L;
Rec_Sig = Rec_Sig + offset*L;
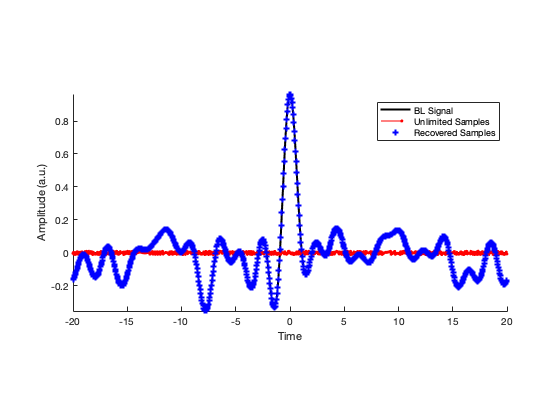
hold on;
plot(t,f,'k')
stem(ts,mdm,'r.','MarkerSize',4)
plot(ts,Rec_Sig,'b*','MarkerSize',2)
axis tight
xlabel('Time')
ylabel('Amplitude (a.u.)')
legend('BL Signal','Unlimited Samples','Recovered Samples')
pbaspect([4 2 2])
Kn_iter =

    16


Kn_iter =

    -8


Kn_iter =

     4


Kn_iter =

    -2


Kn_iter =

     1


Kn_iter =

     0
subplot(2,2,1)
hold on;
plot(t,f,'Color',[1 1 1].*0.6)
stem(ts,mdm,'Marker','.','MarkerSize',10,'MarkerFaceColor',[1 0 0],...
'LineWidth',0.5,...
'Color',[1 0 0])
RP = plot(ts,Rec_Sig,'b*','MarkerSize',3);
legend('BL Signal','Modulo Samples','Recovered Samples')
h1 = plot(t,-LT(L,t));
h2 = plot(t,+LT(L,t));
axis tight
xlim([-10 10])
h1.Color = [0 150 255]./255;
h2.Color = [0 150 255]./255;
h1.Color(4) = 0.7;
h2.Color(4) = 0.7;
RP.Color(4) = 0.2;
xlabel('Time')
ylabel('Amplitude (a.u.)')
subplot(2,2,3)
hold on;
stairs(t,f - M(f,L),'Color',[1 1 1].*0.6,'LineWidth',2)
h1 = plot(ts,cumsum([0 ; bl])+offset*L,'b*');
h1.Color(4) = 0.3;
plot(ts, data - mdm,'rsq','MarkerSize',2)
axis tight
xlim([min(t) max(t)])
xlabel('Time')
ylabel('Amplitude (a.u.)')
xlim([-10 10])
subplot(2,2,[2 4])
hold on;
for DO_iter = 1:DO
MDO(DO_iter,:) = [zeros(DO_iter,1);M(diff(mdm,DO_iter),L)];
end
plot(ts,MDO,ts,[0 ; M(diff(M(data,L)),L)],'r')
h1 = plot(t,-LT(L,t));
h2 = plot(t,+LT(L,t));
axis tight
h1.Color = [0 150 255]./255;
h2.Color = [0 150 255]./255;
h1.Color(4) = 0.7;
h2.Color(4) = 0.7;
axis tight
xlim([min(t) max(t)])
xlabel('Time')
ylabel('Amplitude (a.u.)')
FS = 12;
X = 600; Y = 220;
fig = gcf;
set(fig, 'Position', [0, 0, X, Y]);
fig = gcf;
set(findall(fig,'-property','FontSize'),'FontSize',FS)
set(fig, 'Position', [0, 0, X, Y].*2.5)

Report on Reconstruction
clc
disp(sprintf(['Max-norm (Bg): %g'], Bg));
disp(sprintf(['ADC Threshold: %g'], L));
disp(sprintf(['Maximum Derivative Order: %g'], DO));
disp(sprintf(['Reconstruction MSE is %g'], immse(Rec_Sig,data)));
Max-norm (Bg): 1
ADC Threshold: 0.01
Maximum Derivative Order: 7
Reconstruction MSE is 2.75463e-32