I want to visualize crowds of people at a web site. I want to have some visual feel for the people in the Media Lab web site; how many people are here now, where are they now, where are they going. I want to see flash crowds, I want to see empty places, I want to see the everyday people milling around.
To do this design completely requires solving several problems:
To solve the spaces problem, I'm going to use Alan Wexelblat's Footprints PhD research as a basis. The core idea of Footprints is to watch people moving through a web site, record the common pathways, and then use that to present an image of the site.

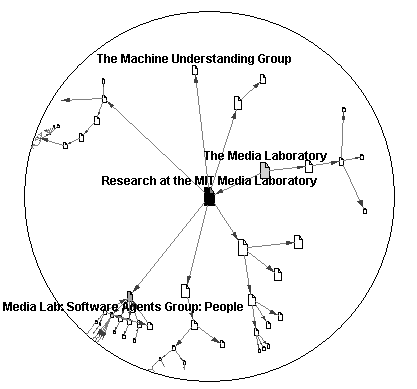
The map is basically a graph-view of web pages. The arrows between pages are not directly hyperlinks, though; instead, they represent common paths that people travel along. Alan's backend algorithms do a lot of fancy work to try to lay the graph out nicely; they work fairly well.
The graph view of a web site is implemented with a fisheye view. Fisheye views are a bit odd; the effect is that whatever you're looking at the most is big, and then the edges of the image shrink off to very small at the edges of the circle. (Technically, it's a hyperbolic sphere projection). Fisheyes are good for letting you focus on a piece of a large space while still retaining context for the rest of the space. It's a reasonable way to visualize a large site.

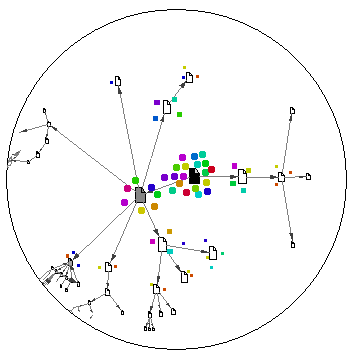
My planned visualzation is fairly simple. Simply take the Footprints view of a site, and then cluster around it coloured dots that represent individual visitors. This view is focussed on two pages in the middle that currently have the most visitors. You can also see some people off in the distance, on pages further away.
The view will be dynamic; I hope to make this operate in real-time (or compressed time) by reading the logs of the web server. Dots will appear as people land on a page. If a person moves from one page to another, their dot will animate, moving from one spot to another. When they leave the site, they disappear.
Getting this design right will be hard. Placing dots so they look right is a challenge, especially through the fisheye projection. Colouring them sensibly requires solving a bit of the "People" problem, although I intend to do something very simple like colour based on the person's domain name. And making the dynamics look smooth and correct, so you get an intuitive sense of crowd flow, will take some work.
An interesting question is how to manage the user's focus; what's in the middle of the fisheye at the moment. It would be nifty to have a mode where the display automatically centers you on wherever the most activity is at the moment. I'm not sure if I can do that without being jarring.
I plan on taking Alan's Footprints software and augmenting it with the coloured dots view. Technically, this means putting in a new thread in his Java application that manages reading the web logs and drawing the dots.
Dots will be placed in a series of concentric circles surrounding each page. So if there are only a few readers, the page will have a respectful circle around it. As the page gets more crowded, more and more readers will fill out in the back, creating a larger crowd. This approach implies that the crowd always has uniform density: I'm not sure if that's a good choice, but I want to try it.
I'm not sure yet how to manage the motion of the dots. The simplest thing is just to move them on the straight line between documents. But straight lines are funny things in a hyperbolic projection, so I might need to deal with that a bit.
An individual "person" will be defined as one IP address in the web server log. Yes, that's not correct, but it's all you can do without cookies. The application will keep a list of each IP address and their recent activity. If we don't hear from someone in about 80 seconds, we'll assume they have left the page and remove their dot. (Alan has done some interesting work on measuring dwell time on a web page; 80 seconds looks to be a good number.) Colour will be determined by domain name - maybe something as simple as .edu being blue, .com being red, etc - maybe something more subtle. Suggestions welcome!
If this works out right, I will have built a simple visualization of a web site and the crowds moving through it at the moment. Some of the design challenges are quite large; I am trying to simplify those as much as possible, focus on the main goal of being able to quickly see the flow of people through a site.
| Nelson Minar | Created: December 2, 1998 |
| <nelson@media.mit.edu> | Updated: December 15, 1998 |